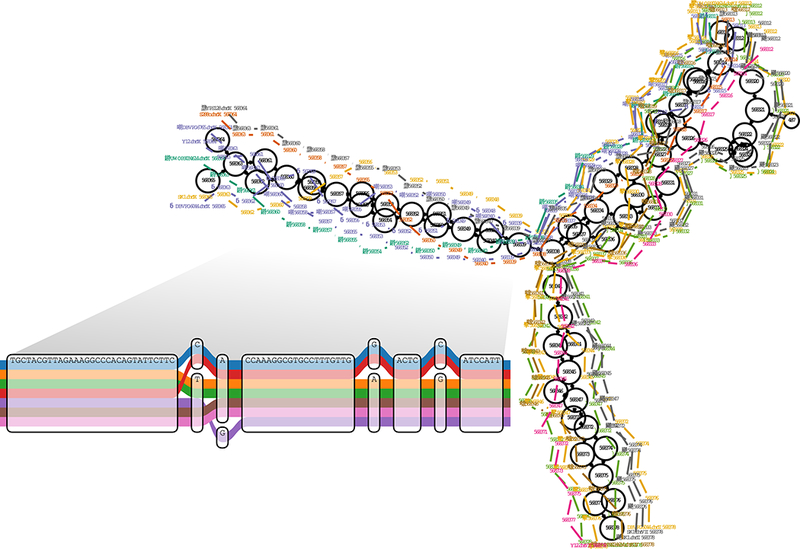
Figure 1.

A region of a yeast genome variation graph. This displays the start of the subtelomeric region on the left arm of chromosome 9 in a multiple alignment of the strains sequenced by Yue et al.22, built using vg from a full genome multiple alignment generated with the Cactus alignment package6. The inset shows a subregion of the alignment at single base level. The colored paths correspond to separate contiguous chromosomal segments of these strains. This illustrates the ability of vg to represent paths corresponding to both colinear (inset) and structurally rearranged (main figure) regions of genomic variation.
