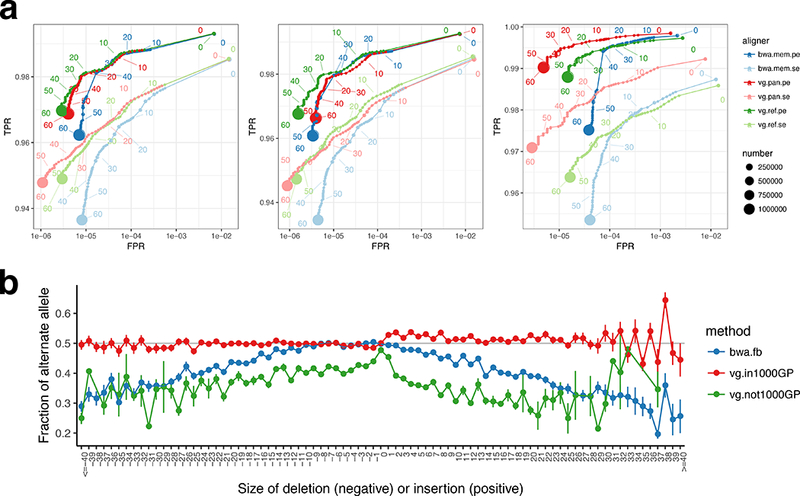
Figure 2:

Mapping accuracy for vg against the human genome. (a) ROC curves parameterised by mapping quality for 10M read pairs simulated from NA24385 as mapped by bwa mem, vg with the 1000GP 1% allele frequency threshold pangenome reference, and vg with a linear reference, using single end (se) or paired end (pe) mapping. Left: all reads, middle: reads simulated from segments matching the linear reference, Right: reads simulated from segments different from the linear reference. (b) the mean alternate allele fraction at heterozygous variants previously called19 in NA24385 as a function of deletion or insertion size (SNPs at 0). Error bars are +/− one standard error.
