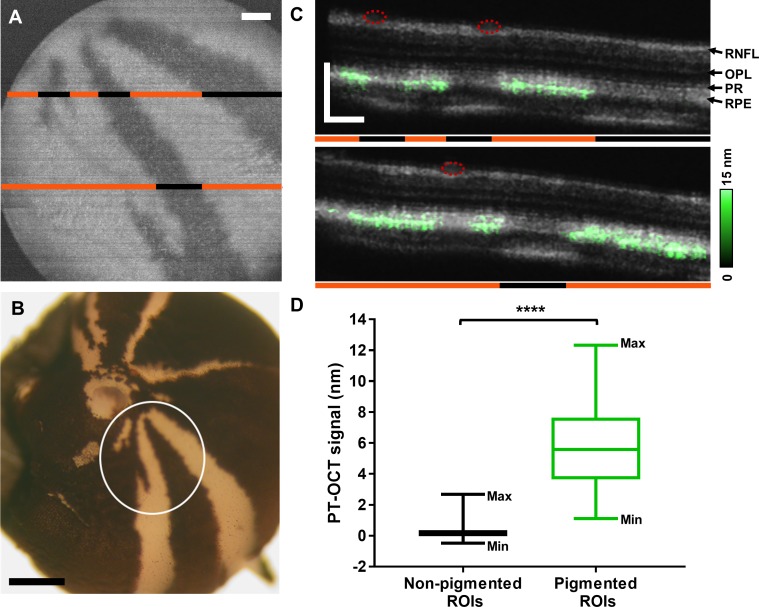
Figure 1.
PT-OCT of melanin in tyrosinase-mosaic zebrafish. (A) En face OCT image of the RPE showing the pigmentation pattern. Areas of pigment are hyperreflective (white) while nonpigmented areas are hyporeflective (dark). (B) Posterior view of the eyecup. White circle indicates field of view shown in (A) where areas of pigment are dark and nonpigmented areas are white. (C) OCT (gray) and PT-OCT (green, overlaid) B-scans of the retina. The locations of the B-scans are indicated by the lines in (A). Orange lines denote pigmented areas and black lines denote nonpigmented areas. Red circles indicate presence of blood vessels. (D) Average PT-OCT signal for all nonpigmented and pigmented ROIs across n = 4 eyes from four zebrafish. Each ROI is 10 A-scans wide. Whiskers on the box plot show minimum and maximum values for each distribution. ****P < 0.0001 Student's t-test. RNFL, retinal nerve fiber layer; OPL, outer plexiform layer; PR, photoreceptors. Scale bar: 100 μm for OCT and 500 μm for histology.

