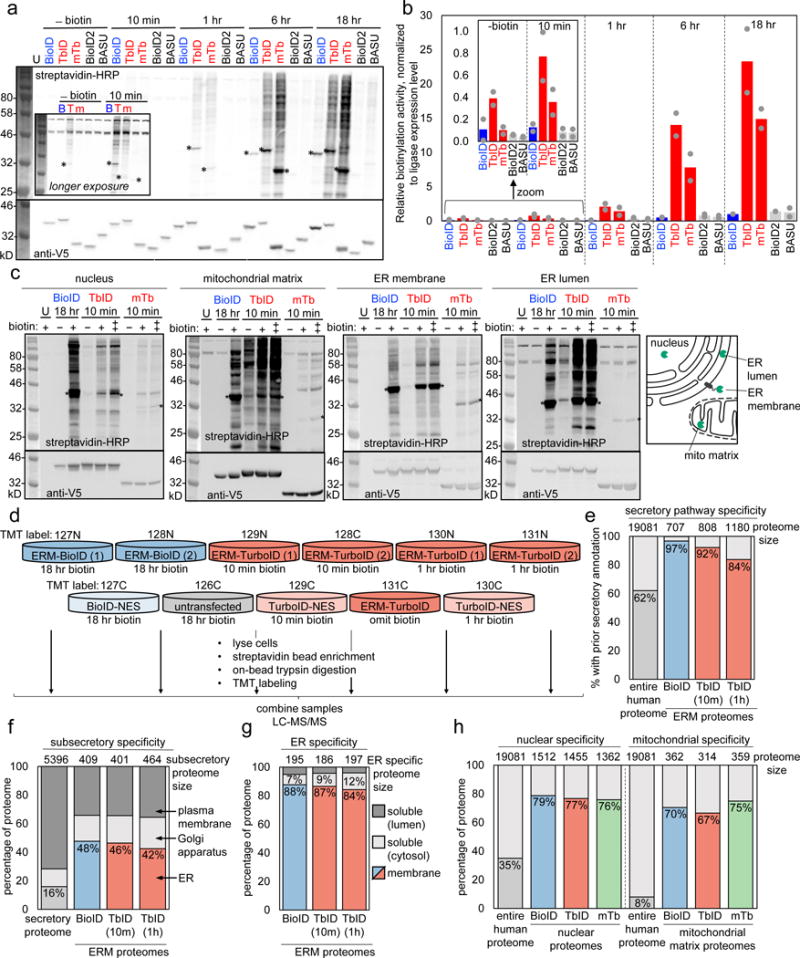
Figure 2. Characterization of TurboID and miniTurbo in mammalian cells.

(a) Comparison of TurboID and miniTurbo to three other promiscuous ligases (BioID5, BioID226, and BASU27) in the cytosol of HEK 293T cells. Here, 500 μM exogenous biotin was used for labeling, whereas 50 μM was used in Supplementary Figure 6c-e. Streptavidin-HRP blotting detects promiscuously biotinylated proteins, and anti-V5 blotting detects ligase expression. U, untransfected. Asterisks denote ligase self-biotinylation bands. This experiment was performed twice with similar results. (b) Quantitation of experiment in (a). For shorter timepoints (-biotin and 10 min), we used a longer-exposure image of the same blot, shown in Supplementary Figure 6a; for longer timepoints (1, 6, 18 hr), we used a shorter-exposure image of the blot in (a), shown in Supplementary Figure 6b. Quantitation performed as in Figure 1g. Grey dots indicate quantitation of signal intensity from each replicate, colored bars indicate mean signal intensity calculated from the two replicates. (c) Comparison of promiscuous ligases in multiple HEK organelles. Each ligase was fused to a peptide targeting sequence (see Supplementary Table 8) directing them to the locations indicated in the scheme at right. BioID samples were treated with 50 μM biotin for 18 hours. TurboID and miniTurbo samples were labeled for 10 minutes with 50 (+) or 500 (++) μM biotin. U, untransfected. Asterisks denote ligase self-biotinylation. This experiment was performed five times for nuclear constructs, three for mitochondrial constructs, four times for ER membrane constructs, and twice for ER lumen constructs with similar results. (d) Mass spectrometry-based proteomic experiment comparing TurboID and BioID on the ER membrane (ERM), facing cytosol. Experimental design and labeling conditions. Ligase fusion constructs were stably expressed in HEK 239T. BioID samples were treated with 50 μM biotin for 18 hours, while TurboID samples were treated with 500 μM biotin for 10 minutes or 1 hr. After labeling, cells were lysed and biotinylated proteins were enriched with streptavidin beads, digested to peptides, and conjugated to TMT (tandem mass tag) labels. All 11 samples were then combined and analyzed by LC-MS/MS. This experiment was performed once with two replicates per condition. (e) Specificity analysis for proteomic datasets derived from experiment in (d). Size of each ERM proteome at top. Bars show percentage of each proteome with prior secretory pathway annotation, according to GOCC, Phobius, human protein atlas, human plasma proteome database, and literature (see Methods and Supplementary Table 2 Tab 4). (f) Same as (e), except for each ERM proteome, we analyze the subset with ER, Golgi, or plasma membrane annotation. Annotations from GOCC were assigned in the priority order: ER>Golgi>plasma membrane (see Methods and Supplementary Table 2 Tab 5). (g) Breakdown of ER proteins enriched by TurboID and BioID, by transmembrane or soluble. Soluble proteins were further divided into luminal or cytosol-facing. Annotations obtained from GOCC, UniProt, TMHMM, and literature (see Methods and Supplementary Table 2 Tab 6). (h) Characterization of nuclear and mitochondrial matrix proteomes obtained via BioID (18 hour), TurboID (10 min), and miniTurbo (10 min)-catalyzed labeling. Proteome sizes across top. Bars show fraction of each nuclear (left) or mitochondrial (right) proteome with prior nuclear or mitochondrial annotation, according to GOCC, MitoCarta, or literature (see Methods and Supplementary Table 3 Tab 1, Supplementary Table 4, Tab 1). Design of proteomic experiment shown in Supplementary Figure 10a, proteomic lists in Supplementary Tables 6-7; further analysis of proteome data in Supplementary Figure 10.
