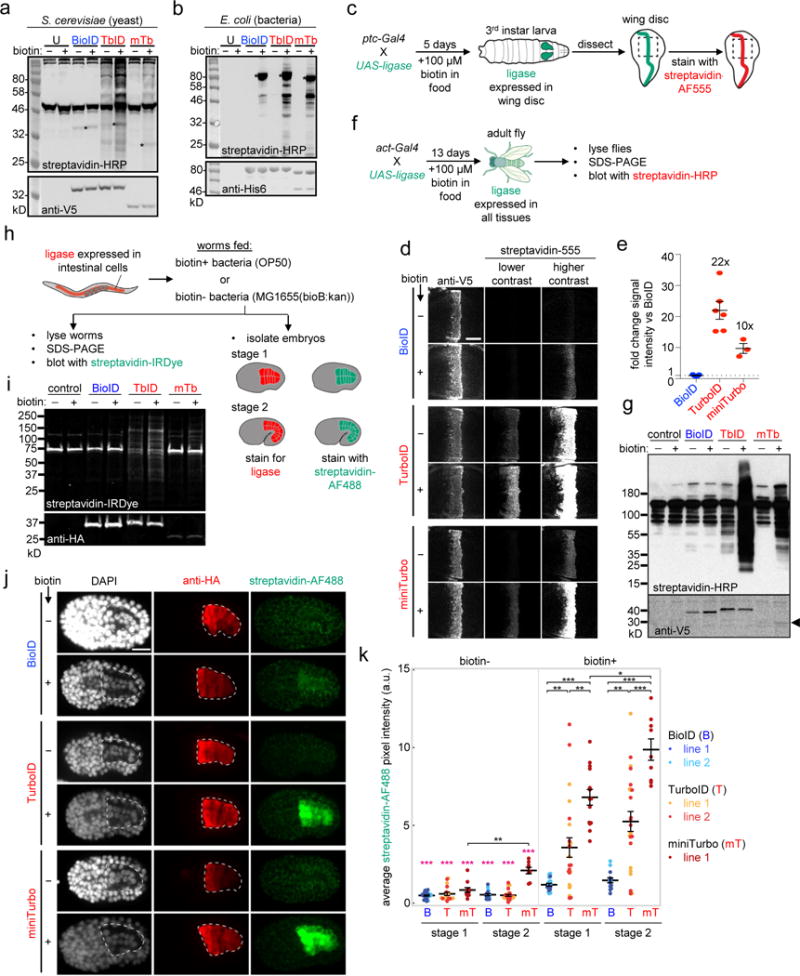
Figure 3. TurboID and miniTurbo in flies, worms, and other species.

(a) Comparison of ligases in yeast. EBY100 S. cerevisiae expressing BioID, TurboID, or miniTurbo in the cytosol were treated with 50 μM biotin for 18 hours. Whole cell lysates were blotted with streptavidin-HRP to visualize biotinylated proteins, and anti-V5 antibody to visualize ligase expression. U, untransfected. Asterisks denote ligase self-biotinylation. Bands in untransfected lane are endogenous naturally-biotinylated proteins. This experiment was performed twice with similar results. (b) Comparison of ligases in E. coli. Ligases, fused at their N-terminal ends to His6-maltose binding protein, were expressed in the cytosol of BL21 E. coli and 50 μM exogenous biotin was added for 18 hours. Whole cell lysates were analyzed as in (a). This experiment was performed twice with similar results. (c) – (g) Comparison of ligases in flies. (c) Scheme for tissue-specific expression of ligases in the wing disc of D. melanogaster. ptc-Gal4 induces ligase expression in a strip of cells within the wing imaginal disc that borders the anterior/posterior compartments. (d) Imaging of larval wing discs after 5 days of growth on biotin-containing food. Biotinylated proteins are detected by staining with streptavidin-AlexaFluor555, and ligase expression is detected by anti-V5 staining. Panels show the pouch region of the wing disc, indicated by the dashed line in (c). Scale bar, 40 μm. Each experimental condition has at least three technical replicates; one representative image is shown. This experiment was independently repeated two times with similar results. (e) Quantitation of streptavidin-AlexaFluor555 signal intensities in (d). Error bars, s.e.m. Average fold-change shown as text above bars. Sample size values (n) from left column to right: 5, 6, 3. (f) Scheme for ubiquitous expression of ligases in flies, at all developmental timepoints, via the act-Gal4 driver. (g) Western blotting of fly lysates prepared as in (f). Biotinylated proteins detected by blotting with streptavidin-HRP, ligase expression detected by anti-V5 blotting. In control sample, act-Gal4 drives expression of UAS-luciferase. Bands in control lanes are endogenous naturally-biotinylated proteins. This experiment was performed twice with similar results. (h) – (k) Comparison of ligases in worms. (h) Scheme for tissue-specific expression of ligases in C. elegans intestine via ges-1p promoter. Transgenic strains are fed either biotin-producing E. coli OP50 (biotin+), or biotin-auxotrophic E. coli MG1655bioB:kan (biotin-). Promoter ges-1p drives ligase expression approximately 150 minutes after the first cell cleavage. (i) Adult worms prepared as in (h) were shifted to 25°C for one generation, then lysed and analyzed by Western blotting. Control worms (N2) do not express ligase. Anti-HA antibody detects ligase expression. Streptavidin-IRDye detects biotinylated proteins. This experiment was performed five times (n = 5). In biotin+ conditions, BioID biotinylation activity was undetectable and TurboID gave robust biotinylation signal (n = 5/5). Despite high activity detected by immunofluorescence in embryos, we only detected some low level of biotinylation by miniTurbo in adults (n = 2/5), likely due to its low expression levels. (j) Representative images of bean stage worm embryos (stage 1) from (h). See Supplementary Figure 15a for representative images of comma stage worm embryos (stage 2). Embryos were fixed and stained with streptavidin-AF488 to detect biotinylated proteins, and anti-HA antibody to detect ligase expression. Intestine is outlined by a white dotted line. Scale bar, 10 μm. Quantitation of multiple replicates shown in (k). (k) Quantitation of streptavidin-AF488 signal acquired from IF staining of embryonic stages 1 and 2 shown in (j) and Supplementary Figure 15a. Mean streptavidin pixel intensities for each embryo assessed are plotted for BioID (B), TurboID (T), and miniTurbo (mT). Two independent transgenic lines for BioID and TurboID and one for miniTurbo were assessed. Number of embryos imaged (n) from left to right: 26, 18, 11, 16, 25, 8, 19, 23, 14, 14, 23, 9. Statistical significance via Mann-Whitney U test (two-sided). ***p ≤ 0.0001, **p ≤ 0.001, *p ≤ 0.01. Pink asterisks indicate significance of pairwise comparisons between biotin- and corresponding biotin+ treated embryos. Mean (reported in Supplementary Figure 15b) is shown as a black horizontal line for each condition, and error bars indicate s.e.m. Note that the streptavidin-AF488 pixel intensities for miniTurbo are an underrepresentation of the signal as camera exposure settings were lowered to avoid pixel saturation (see Methods). See Supplementary Figure 15 for more details.
