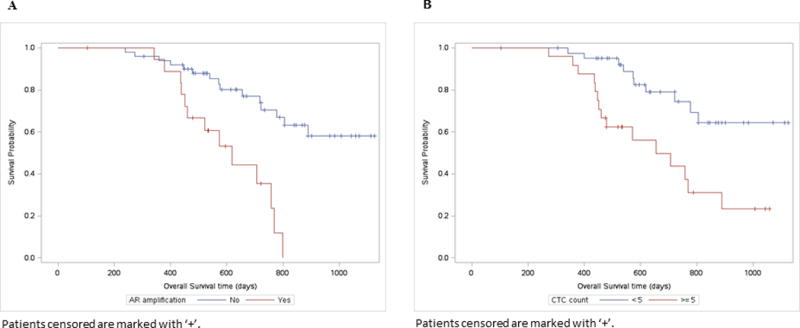
Figure 1.

A: Kaplan Meier curves for baseline plasma cfDNA AR amplification with overall survival.
B: Overall Survival by CTC Count at baseline. Patients with CTC counts greater or equal to 5 cells are at higher risk of death than those with < 5 cells (log-rank p-value=0.001).
