Figure 5.

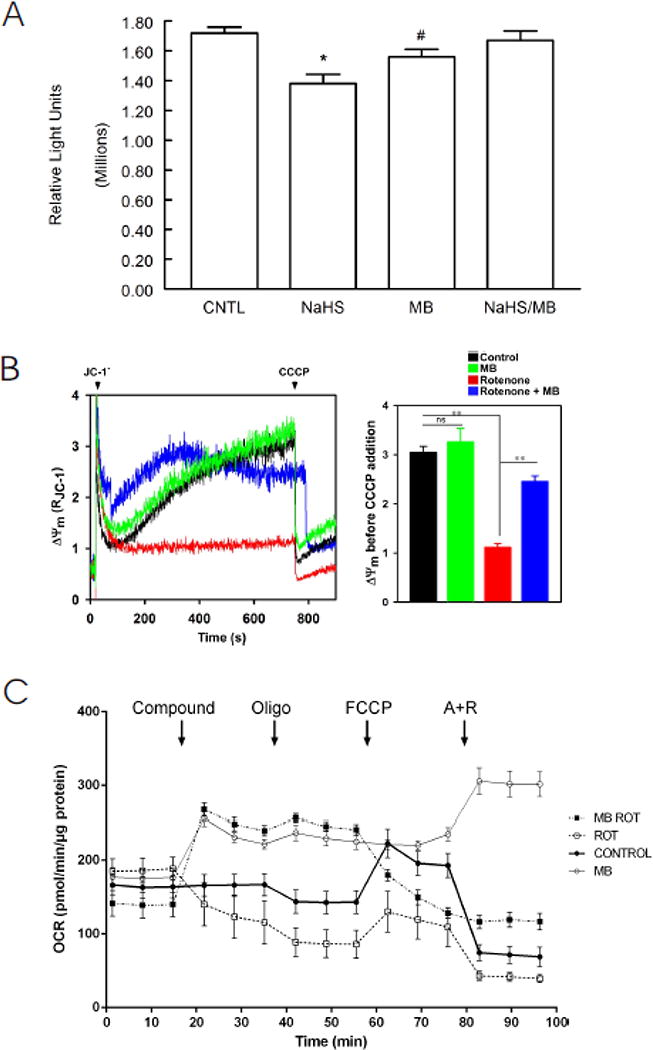
Effects on MB on cardiomyocyte bioenergetics: ATP levels, mitochondrial membrane potential (Δψm), and O2 consumption rate (OCR). (A). ATP (luminescence, relative light units) levels from LV myocytes treated with saline (CNTL, n=8), MB (n=8), NaHS (n=7) and MB + NaHS (n=7) for 10 min were determined with CellTiter-Glo luminescent cell viability kit (Methods). *p<0.0005, CNTL vs. NaHS; #p<0.03; CNTL vs. MB. There are no differences in ATP levels between CNTL and NaHS + MB myocytes (p=0.53). (B). LV myocytes were permeabilized with digitonin and supplemented with succinate. Left: the ratiometric indicator JC-1 was added at 20s and used to monitor Δψm. Arrows indicate addition of JC-1 and the mitochondrial uncoupler CCCP (2 μM), respectively. Rotenone (10 nM) and/or MB (20 μg/ml) were added at time 0. Right: Summary of Δψm before CCCP addition (n=3 each). **p<0.01; ns, not significant. (C). OCR was measured in intact myocytes (Methods). After basal OCR was obtained, either saline control (●), MB alone (20 μg/ml; ○), rotenone (1 μM; □), or MB (20 μg/ml) + rotenone (■) were added (indicated by “Compound”). At times indicated, oligomycin (1 μM) was added to inhibit F0F1ATPase (Complex V) followed by addition of the uncoupler FCCP (1 μM) to measure maximal OCR. Finally, antimycin A + rotenone (1 μM each) were added to inhibit cytochrome bc1 complex (Complex III) and NADH dehydrogenase (Complex I), respectively. Each point in the traces represents the average of 8 different wells. This experiment was repeated 3 times with similar results.
