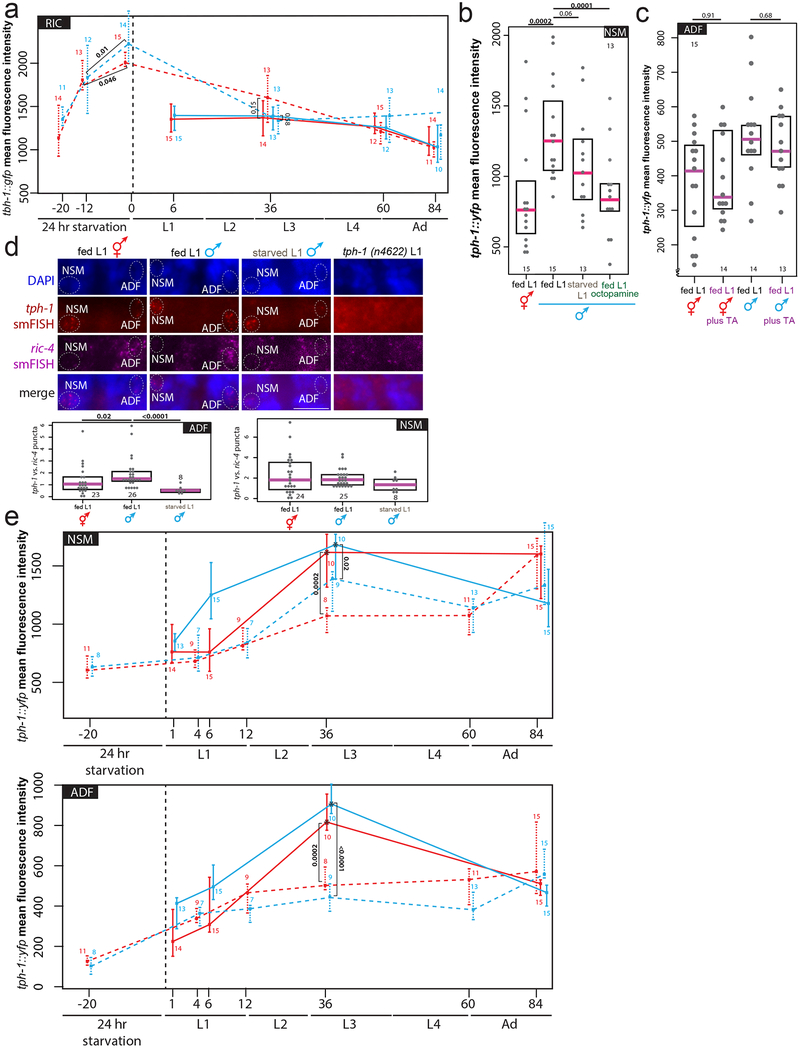
Extended Data Figure 4: Effects of starvation on tbh-1 and tph-1 transcription.
(a) Time-course of tbh-1 transcriptional levels in fed (solid lines) and L1-starved (dashed lines) animals. We note that tbh-1 levels are even higher after 24 hours of starvation vs. 12 hours of starvation, providing a molecular correlate for our observation that 12 hours of starvation is insufficient to affect male-specific synaptic pruning (Fig. 1d). Larval stages (and hours post-hatching for fed animals or post-transfer to food for starved animals at which imaging took place) shown on x-axis. Center indicates median, error bars indicate quartiles (a, e). p-values shown by two-sided Wilcoxon rank-sum test (a, b, c, d, e). n= number of animals (shown below data points for fed, above for L1-starved) (a, e).
(b) Expression levels of a tph-1 transcriptional fosmid in NSM in fed L1 animals, starved L1 animals, or L1 animals fed in the presence of 20mg/mL exogenous octopamine. Each grey dot represents averaged expression level in one animal. Magenta bar indicates median, black box represents quartiles (b, c, d). n= number of animals (shown in each column) (b, c, d).
(c) Expression levels of a tph-1 transcriptional fosmid are not affected in ADF or NSM neurons (NSM data not shown) by exogenous tyramine in fed L1 hermaphrodites and males. “TA”=tyramine.
(d) tph-1 transcript levels quantified by smFISH. Maximum intensity projection images of one half of animal to show one NSM and one ADF neuron. “merge” shows overlay of tph-1 smFISH puncta onto DAPI. Number of tph-1 smFISH puncta were normalized to number of ric-4/SNAP-25 synaptic protein smFISH puncta in the same neuron to control for staining fluctuations, each dot (n=) one neuron, shown in each column.
(e) Time-course of tph-1 transcriptional levels in fed (solid lines) and L1-starved (dashed lines) animals. Larval stages (and hours post-hatching for fed animals or post-transfer to food for starved animals at which imaging took place) shown on x-axis. Asterisks (fed L3 animals) indicate that animals were imaged at different laser settings (60% of all other time points) to prevent pixel oversaturation in images: thus, we under-estimate the magnitude of the L3 serotonin spike here.

