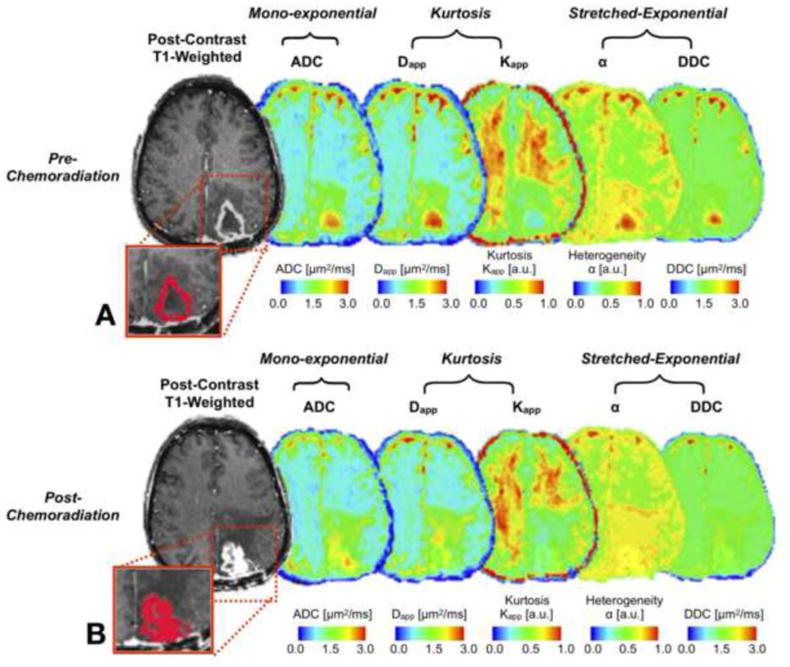
Figure 1. Glioblastoma in the left occipital lobe in a 57-year-old woman with 25.7 months of survival.

Tumor volumes are overlaid on post-contrast T1w images (in red, within rectangle) for one representative slice. Pre- and post-chemoradiation, post-contrast T1w images show contrast enhancing tumor with central necrosis and perilesional hypo-intense signal intensity, suggesting edema. ADC, Dapp, α and DDC maps exhibit lower values in CET regions compared to central necrosis, while Kapp demonstrates moderate intensity in CET regions. Note that ADC and Dapp maps show high positive changes after chemoradiation. Change in values between pre- and post-chemoradiation time-points: ADC=0.202μm2/ms, Dapp=0.143μm2/ms, Kapp= -0.043, α=0.076 and DDC= − 0.007μm2/ms.
