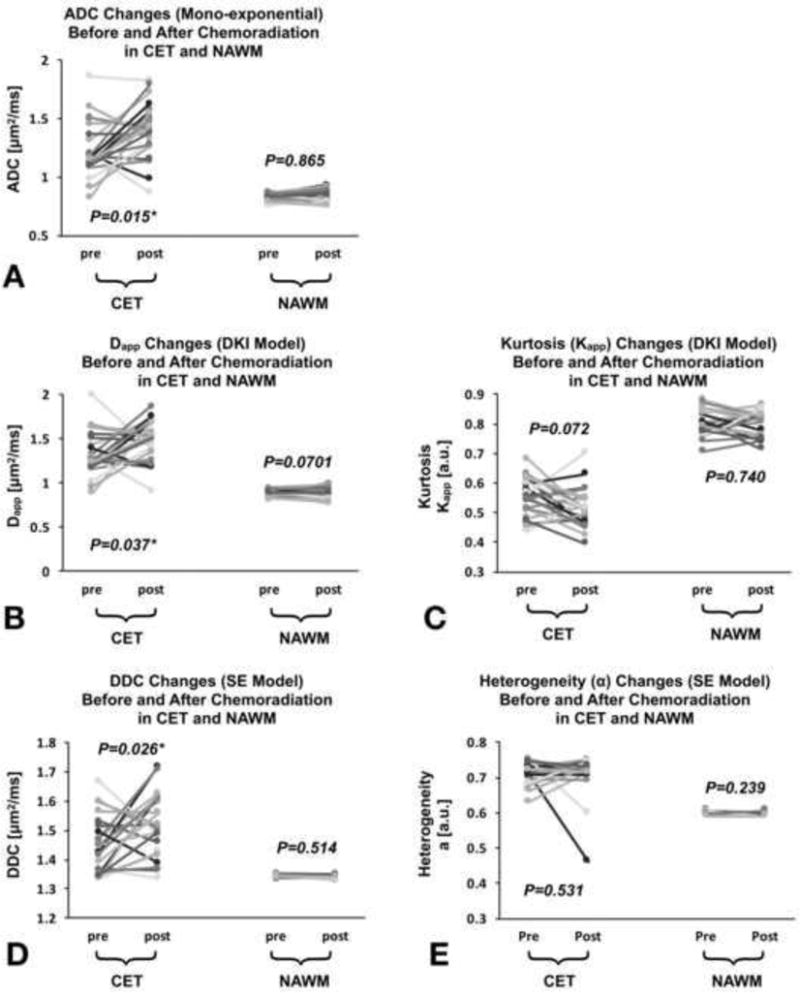
Figure 2. Comparison of different diffusivity measurements (median) within contrast-enhancing tumor (CET) and NAWM regions before and after chemoradiation.

Graphs of ADC (A), Dapp (B), Kapp (C), DDC (D) and α values (E). No differences were found in NAWM from all diffusivity measurement and that across time. ADC, Dapp and DDC were significantly lower within CET before chemoradiation compared with post-chemoradiation, while there were no statistical differences for Kapp and α values. The CET values of ADC, Dapp, α and DDC were significantly higher to NAWM (p<0.0001) at pre- and post-chemoradiation while Kapp maps showing significantly lower values in CET (p<0.0001). The gray scale was used to visualize figures easier.
