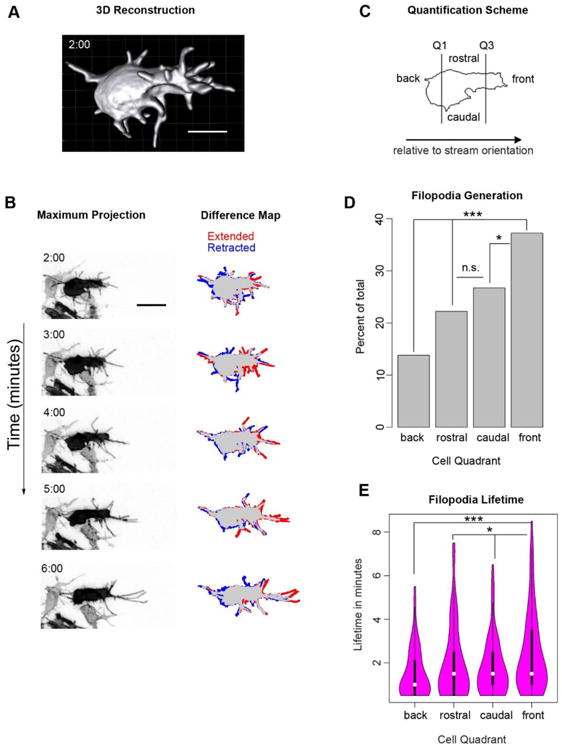
Figure 3. Both the generation and lifetime of neural crest filopodia are biased towards the direction of overall stream migration.

(A) Still image from Movie S4 of a 3D reconstruction of a neural crest cell showing the extensive filopodial extensions and complex 3D morphology of neural crest cells in vivo. Scale bar, 10 μm.
(B) Still images from Movie S5 of a neural crest cell electroporated with pCAGGS-mem-GFP and imaged every 30 seconds for 10 minutes to investigate filopodial dynamics. This is the same cell as that shown in panel A. The difference map shows a comparison of the current frame with the image taken one minute previously, with regions that were extended and retracted labeled with red and blue respectively. Time in minutes; scale bar, 20 μm.
(C) Quantification scheme for filopodia spatial distribution used in graphs D and E. The perimeter of the cell body, excluding filopodia, was determined in every frame and divided into quadrants. The front and back quadrants each have ¼ of the total perimeter while rostral and caudal split the remaining half.
(D) (D and E) Filopodial generation events (D) and the lifetime of these filopodia (E) based on the quadrant where the filopodium was initiated. The direction of overall stream migration (front) has a significantly higher rate of filopodial generation and longer-lived filopodia relative to the back and sides. N=333 filopodia from 8 cells in 3 embryos. * p<.05, *** p<.001 by Chi-square (D) or Mann-Whitney U (E).
