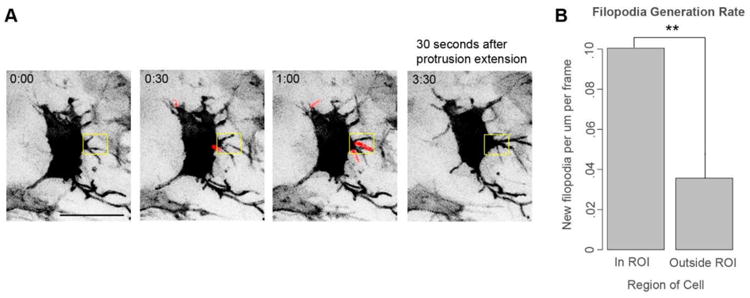
Figure 4. Neural crest cells locally generate a burst of filopodia before extending larger protrusions.

(A) Still images from Movie S6 of a neural crest cell electroporated with pCAGGS-mem-GFP and imaged every 30 seconds. New filopodia are highlighted in red. Box is an ROI bracketing where the new protrusion will emerge. Scale bar, 20 μm.
(B) Quantification of local filopodia generation rate prior to the generation of the new protrusion. Newly-generated filopodia were identified in the z-stack for 2.5 minutes prior to the extension of the protrusion. The filopodia generation rate in the ROI and the rest of the cell was calculated as a function of the cell perimeter length in those compartments. We quantified 9 protrusion generation events in 8 cells in 5 embryos. Filopodia were generated in the region where a new protrusion will emerge at more than double the expected rate compared to other areas of the cell. ** p<.01 by paired t-test.
