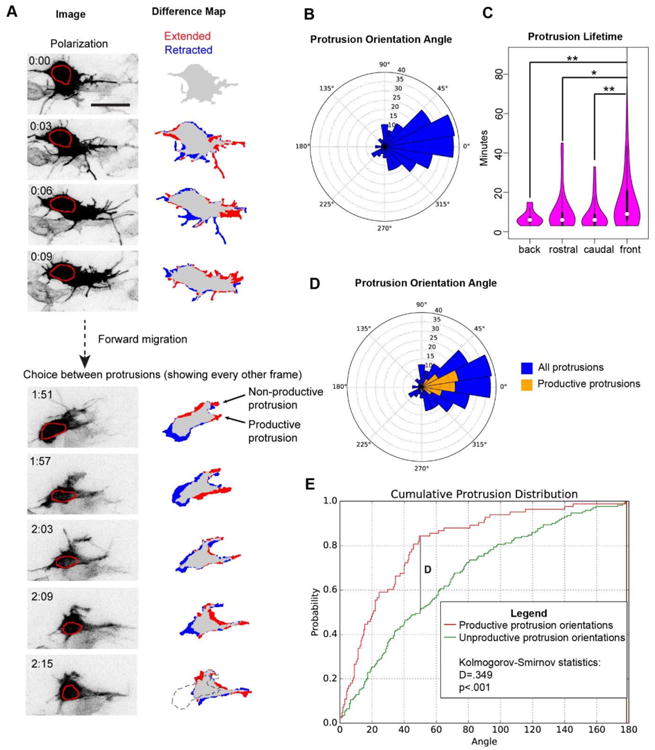
Figure 5. Neural crest cells migrate by biasing both protrusion generation and retraction.

(A) Representative images of a neural crest cell from Movie S7 electroporated with pCAGGS-mem-GFP and pCAGGS-H2B-tdTomato and imaged every 3 minutes. The red circle outlines the nucleus. This cell exhibits typical neural crest cell behaviors such as polarization, forward migration, and choice among multiple protrusions. Difference map shows a comparison of the current frame with either the image taken three minutes earlier for the analysis of polarization (top panels) or six minutes earlier in the analysis of choice between protrusions (bottom panels), with regions that were extended and retracted labeled red and blue respectively. Dotted outline is silhouette of cell at 1:51. Time in hours:mins, scale bar 20 μm. See Movie S7 and S8.
(B) Quantification of protrusion orientation angle in HH11-12 embryos. N=253 protrusions from 21 cells in 3 embryos. Protrusion angles are strongly polarized towards the direction of overall stream migration (p<.001 by Kolmogorov-Smirnov compared to a uniform distribution).
(C) Protrusion lifetime, excluding frames when the protrusion is being retracted. Protrusions were binned by angle relative to the direction of stream movement. *p<.05, **p<.01 by Mann-Whitney U. Protrusions aligned toward the direction of overall stream movement have longer lifetimes than those protrusions that point in other directions.
(D) Orientation angle of all protrusions (blue) and productive protrusions (gold). Productive protrusions were defined as ones where the nucleus enters the region that the protrusion was; i.e. what was once a protrusion is now the cell body.
(E) Normalized cumulative histogram of productive and non-productive protrusion orientations. Protrusion orientations were collapsed to 0° to 180° to enable the use of more standard statistical tests. Productive protrusion orientations were more tightly clustered around the direction of overall stream movement than non-productive protrusions.
