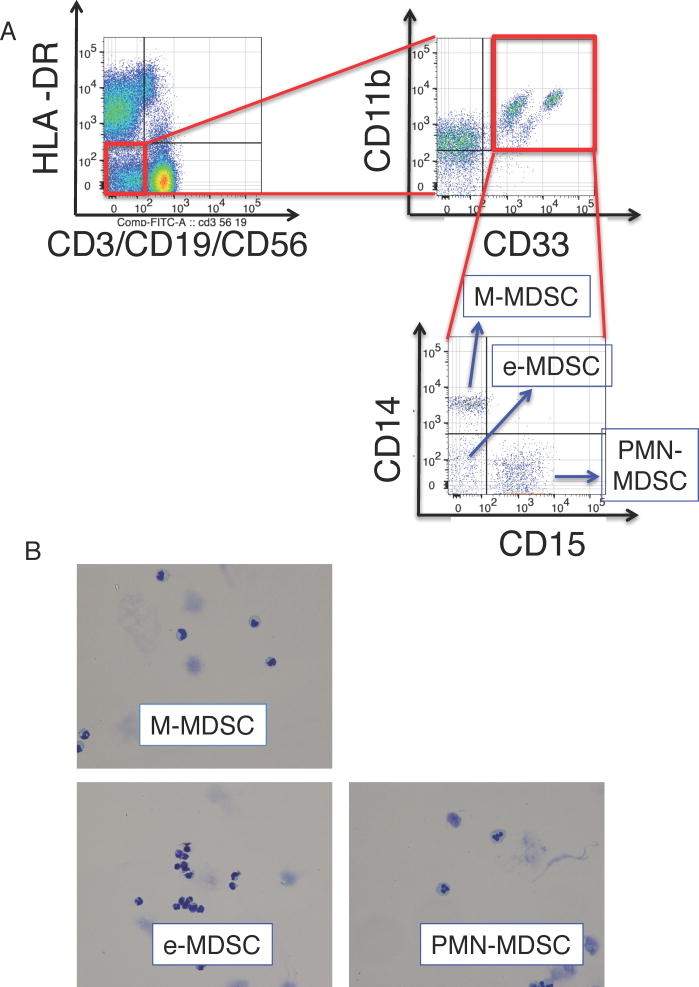
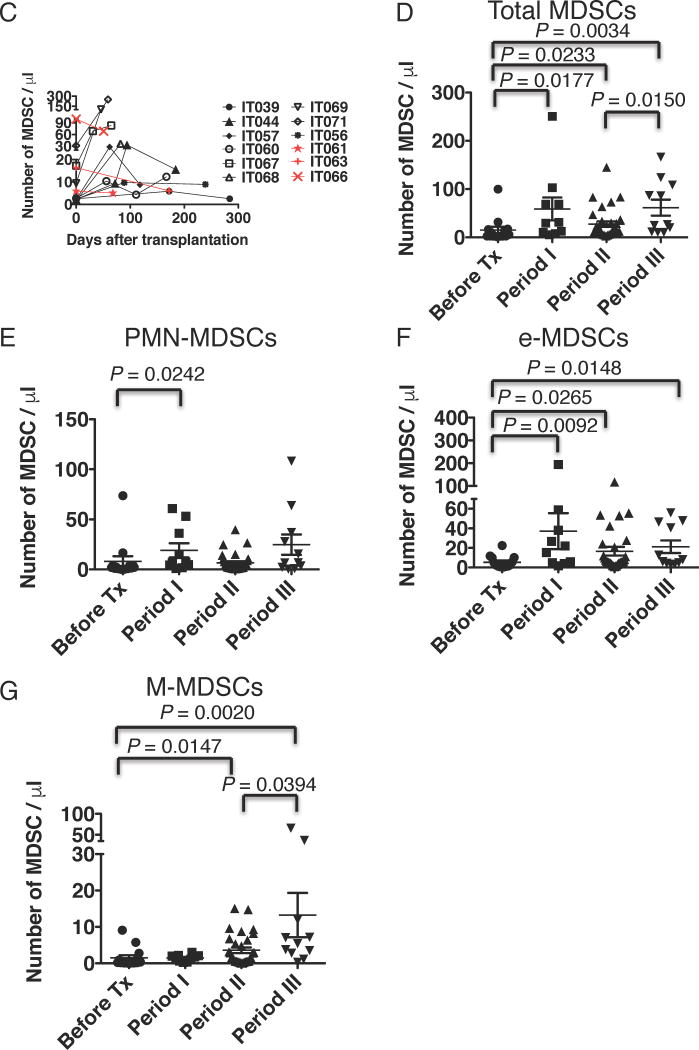
Figure 1. Phenotypes of MDSCs and increase in MDSCs in IT patients.
(A) The PBMCs were stained with fluorescent-labelled antibodies and analyzed using flow cytometry. The obtained cells were gated on an extended monocyte population based on FSC vs SSC, and doublet cells (FSC-A vs FSC-H, SSC-A vs SSC-H, and FSC-H vs FSC-W) and dead cells (FSC-A vs 7-aad) were excluded. The left dot plot demonstrates expression of lineage (CD3, CD56, CD19) and HLA-DR, and a population of HLA-DR−lineage− is gated (the red circle). MDSCs were defined as HLA-DR−lineage−CD33+CD11b+ cells (the upper right dot plot). MDSCs were further classified as CD14−CD15− (e-MDSC), CD14+CD15− (M-MDSC), and CD14−CD15+ (PMN-MDSC) (the lower right dot plot). Representative data from sample no. IT071 v1 is shown. (B) Each subset of MDSCs were sorted by flow cytometry and stained with Giemsa stain. (C) The line graph demonstrates changes with time in MDSC numbers per 1 µl of peripheral blood, which we obtained in sequential sampling, after ITx in individual patients. Numbers of MDSCs increased in 9 of 12 ITx patients (black lines, n = 9), but not in three of them (red lines). The Y-axis is arranged in three segments with different scales to easily visualize the changes in MDSC numbers. (D–G) Graphs demonstrate the total MDSC number (D) and the numbers of PMN-MDSCs (E), e-MDSCs (F), and M-MDSCs (G) per 1 µl of peripheral blood of ITx patients during the pre-transplant period (before Tx, n = 14, circles), within 2 months (period I, n = 10, squares), 2 months to 1 year (period II, n =31, triangles), and more than 1 year (period III, n = 11, reverse triangles) after ITx. Each dot represents individual data, and horizontal lines represent the mean numbers. Statistical significances are indicated in the graphs (Mann-Whitney U test).


