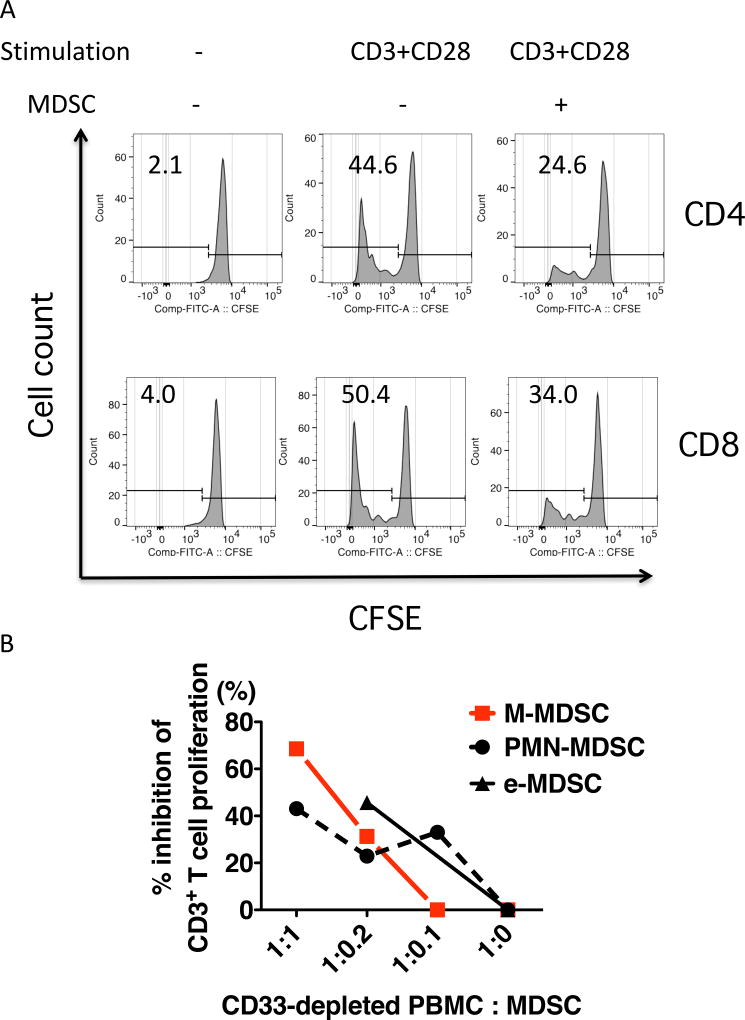
Figure 2. Cells with MDSC phenotype suppress T cell proliferation.
CFSE-labeled, magnetically CD33-depleted PBMCs (1×10⁵) during the pre-transplant period were stimulated with plate-coated anti-CD3 and anti-CD28 antibodies in 200 µl of T cell-proliferating complete medium in a flat bottom 96-well plastic plate (center and right histograms). For negative controls, 1×10⁵ cells were cultured without antibody stimulation (the left column). MDSCs enriched by magnetic beads (the lineage−HLA-DR− and CD33+ cells) from PBMCs on day 184 after ITx were added into the culture wells (the right histograms: CD33-depleted PBMCs : MDSCs = 5 : 1). Histograms demonstrate fluorescent levels of CFSE in CD4 (the upper histograms) and CD8 (the lower histograms) T cells, which were gated out as a population of singlet, live CD3+CD4+ and CD3+CD4+ cells, respectively. The numbers indicated in the histograms indicate percentages of CFSE-low T cells. Representative data from sample no. IT044 are shown. Similar data were obtained from two other patients. (B) T cells were cultured with or without flow-sorted MDSC subsets, as described in A. The line graph demonstrates percent inhibition of CD3+ T cell proliferation by M-MDSCs (red squares), PMN-MDSCs (black circles), and e-MDSCs (triangles) at the indicated PBMC : MDSC ratios. Representative data from sample no. IT034 on day 458 after ITx are shown. Similar data were obtained from two other patients.

