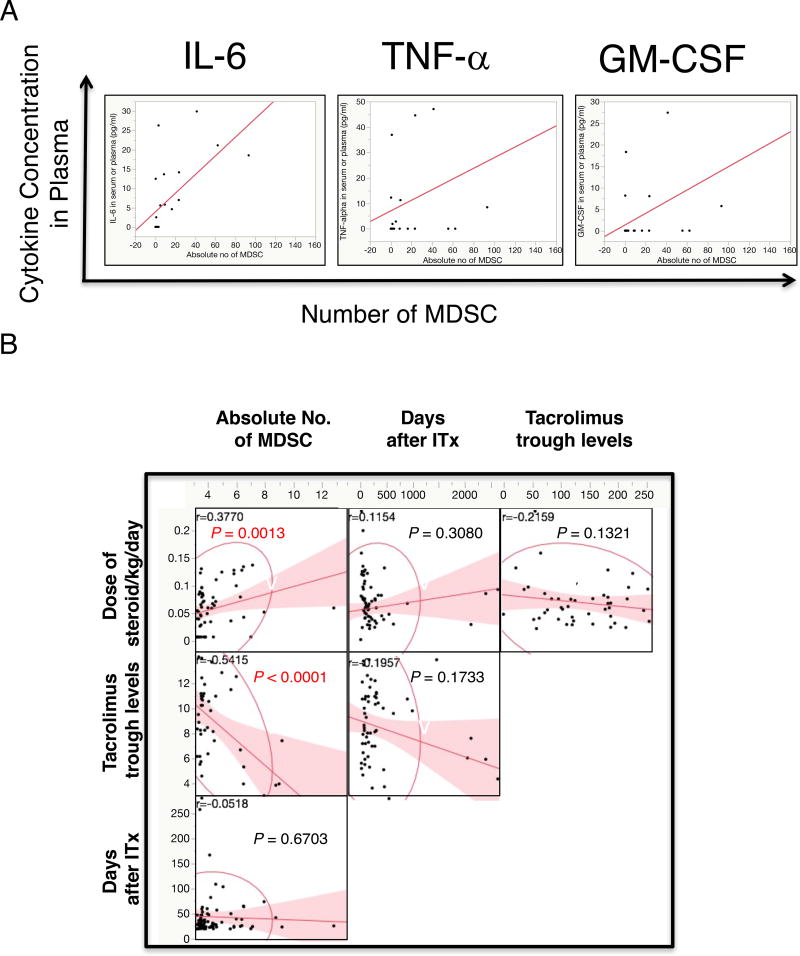
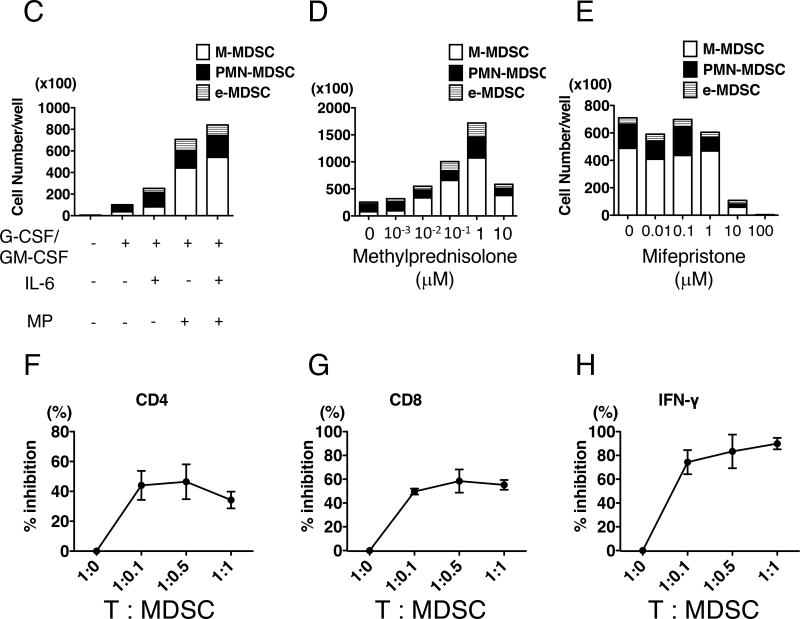
Figure 3. Exogenous steroid hormone and IL-6 are important factors in enhancing MDSC differentiation from BMCs.
(A) Cytokines levels in plasma were measured, and linear regression analysis was performed. The scatter plots demonstrate correlation between MDSC numbers and plasma IL-6 levels (left), TNF-α (middle) and GM-CSF (right). Plasma IL-6 levels (Y) (X; r = 0.6888, p = 0.0278, correlation: Y = 3.8703 + 0.2420 X, n = 14), but not TNF-α (p = 0.3638, n = 15) and GM-CSF (p = 0.1942, n = 12), were moderately correlated with MDSC numbers. (B) Correlations between administered doses of steroid [normalized value/body weight (kg), n = 72], tacrolimus trough levels (n = 55), days after transplantation (n = 72), and absolute numbers of MDSCs were investigated using multiple linear regression analysis. The Spearman’s rank correlation coefficient (r) and p values are indicated in each scatter plots, and the red lines show fitted linear lines. (C–E) The bar graph demonstrates the numbers of M-MDSCs (white bars), PMN-MDSCs (black bars), and e-MDSCs (striped bars). BMCs were cultured for 6 or 7 days. Representative data from two independent experiments are shown. Culture medium was supplemented with G-CSF and GM-CSF, IL-6, and/or MP (C), with G-CSF, GM-CSF, IL-6 and various concentrations of MP (D), or with G-CSF, GM-CSF, IL-6, MP, and various concentrations of mifepristone (E), as indicated under the X-axis of the bar graphs. (F–H) CFSE-labeled, CD33-depleted mononuclear cells from BMCs were cultured with a cocktail of irradiated allogeneic B cells and flow-sorted autologous BMC-derived MDSCs at the indicated T : MDSC ratios under the X-axis. Proliferation of CD3+CD4+ (F) and CD3+CD8+ (G) cells and IFN-γ production in the cultured medium (H) were measured. The graphs demonstrate % inhibition compared to data from co-culture without MDSCs. Representative data from two independent experiments are shown.


