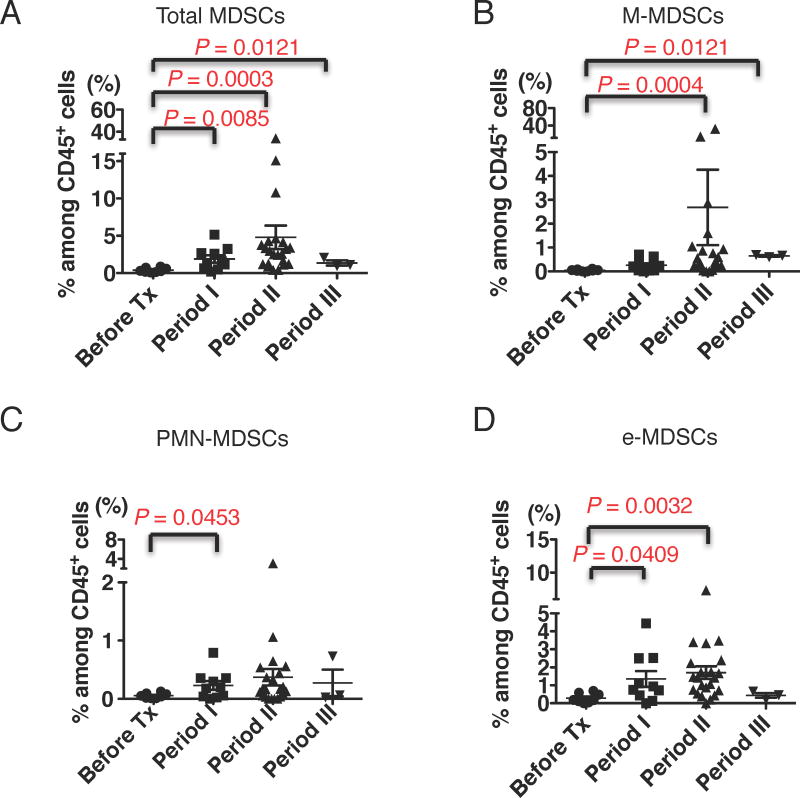
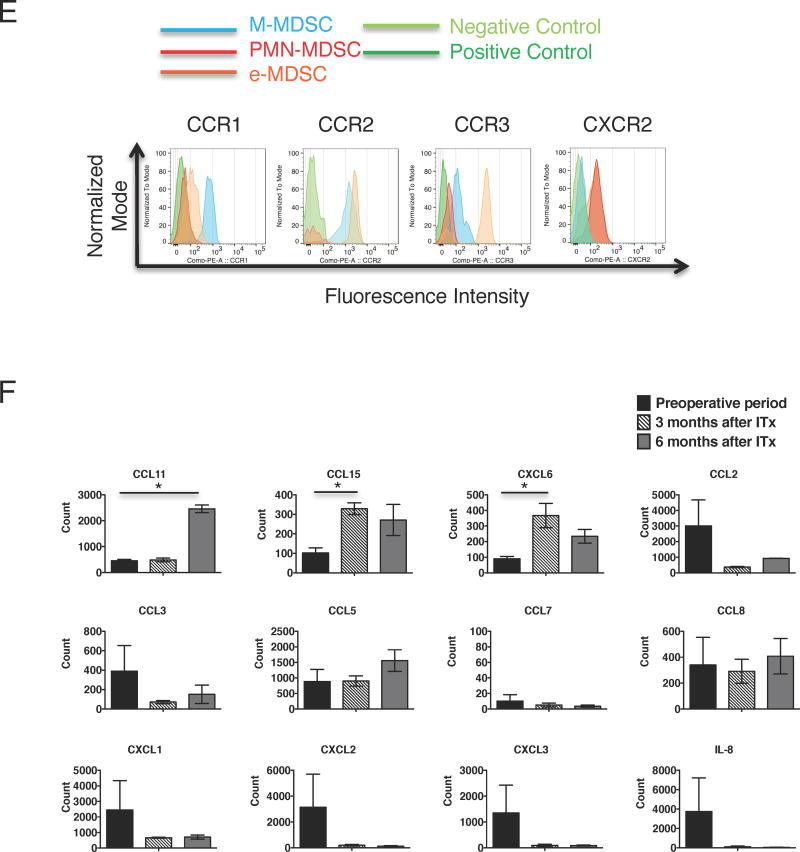
Figure 5. MDSCs increase in allograft intestinal mucosa after ITx.
(A–D) MDSCs infiltrating in LPC were detected as shown in Figure S5 and the Materials and Methods. The scatter plots show the percentages of total MDSCs (A), M-MDSCs (B), PMN-MDSCs (C), and e-MDSCs (D) among CD45+ mononuclear cells of LPC during the pre-transplant periods (before Tx, n = 8, circles), within 2 months (period I, n = 10, squares), 2 months to 1 year (period II, n =22, triangles), and more than 1 year (period III, n = 3, reverse triangles) after ITx. Each dot shows individual data of MDSCs, and horizontal lines show the mean percentage ± SEM. Statistical significances are indicated in the graphs (Mann-Whitney U test). (E) The histograms show expressions of CCR1, CCR2, CCR3, and CXCR2 on M-MDSCs (blue), PMN-MDSCs (red), e-MDSCs (orange) and internal negative (light green) and positive (dark green) controls, which are expected not to express and to express each chemokine receptors, respectively. Similar results were obtained from 5 to 10 different recipients. (F) mRNAs were extracted from pre-transplant grafts (black bar, n = 3), intestinal grafts at 3 months (striped bar, n =3), and those at 6 months (gray bar, n = 2) after ITx and were analyzed using nanoStrings® system. Bar graphs show the mean normalized counts of mRNA ± SEM for indicated chemokine ligands. The statistical p values were calculated using a one-way ANOVA with Bonferroni post hoc tests and are indicated in the graphs (* p < 0.05).


