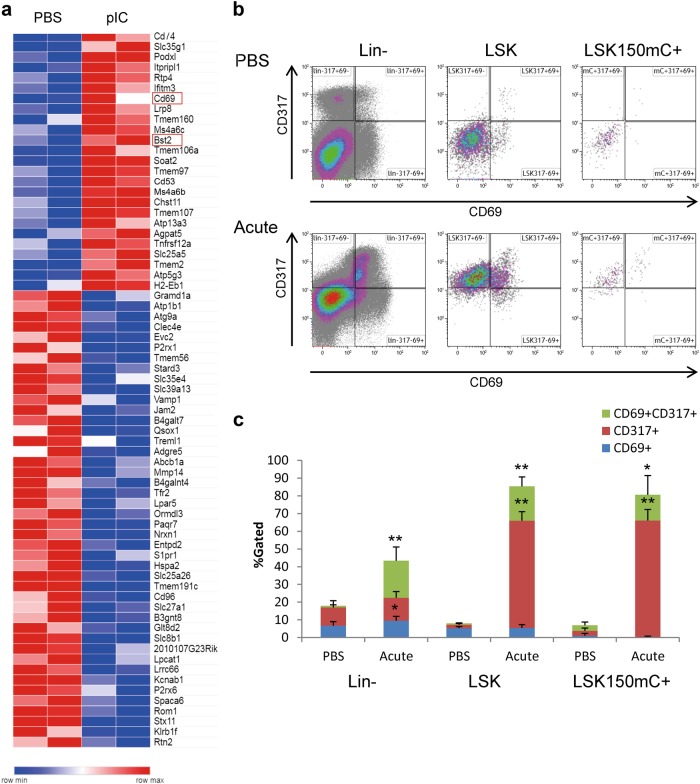
Fig. 2.
Surface markers of acutely activated HSCs. a A heatmap of 75 differentially expressed (DE) surface markers (GO:0016021, of 435 DE genes) under control (PBS) conditions and 24 h after an acute pIC stimulation. b Representative FACS plots showing the expression of CD69 (x-axis) and CD317 (Bts2, y-axis) in control conditions (PBS; top panels) and 24 h after an acute pIC stimulation (bottom panels). Plots are shown for the Lineage-negative (Lin−, left panels), Lineage−cKit+Sca1+ (LSK, middle panels), and LSKCD150+mCh+ (right panels) populations. c Quantification of the frequencies of indicated populations of CD69+CD317+ (green), CD317+CD69− (red), and CD69+CD317− (blue) cells. Histograms show averages and standard deviations of the control (PBS) and pIC-treated (Acute) cells; *p < 0.05, **p < 0.01

