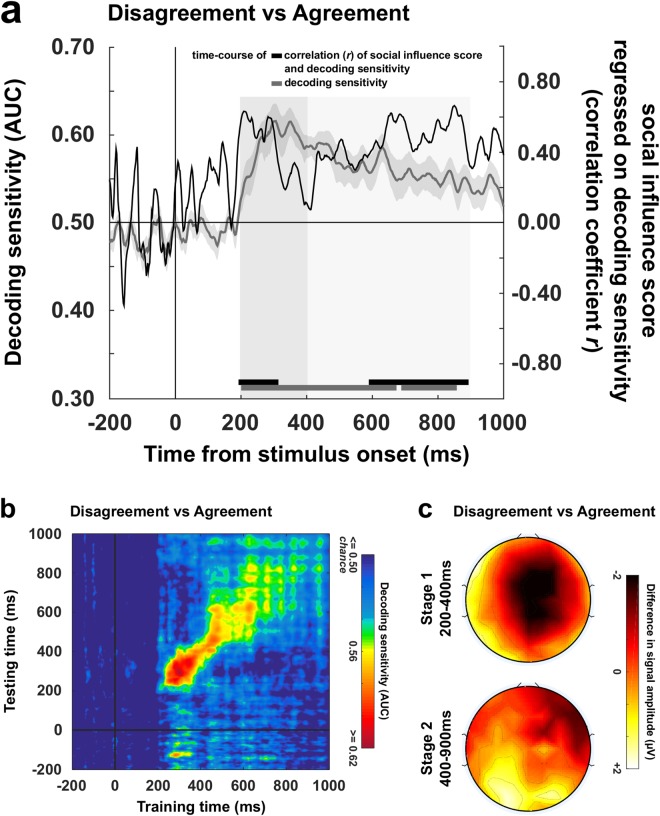
Figure 3.
Decoding stages of public information processing and temporal generalization. (a) The grey curve represents the sensitivity of the decoder (±SEM) that was trained to classify disagreement trials and agreement trials on the basis of the EEG activity (left y axis) recorded during the 1000 ms following the exposure to public information (x axis). Disagreement trials are entered in the classification pipeline irrespective of their valence and strength. Clusters of adjacent time-points in which the decoder’s sensitivity significantly differed from chance are represented by the grey markers located up to the x axis. The black curve represents the time-course of correlation (coefficient r, right y axis) between decoding sensitivities of public information processing and social influence scores. Clusters of adjacent time-points in which the correlation coefficient r was >0.40 are represented by the black markers located up to the x axis. (b) Decoders trained at each time point were tested on data from all other time points, revealing the presence of two distinct processing stages (stage 1 = 200–400 ms post-stimulus; stage 2: 400–900 ms post-stimulus). The diagonal (where testing time = training time) gives the curve for canonical decoders performance over time. (c) Topographical maps of the differential EEG activity resulting from the contrast between the two classes of stimuli that were entered in each decoder are representative of processing stages 1 and 2.

