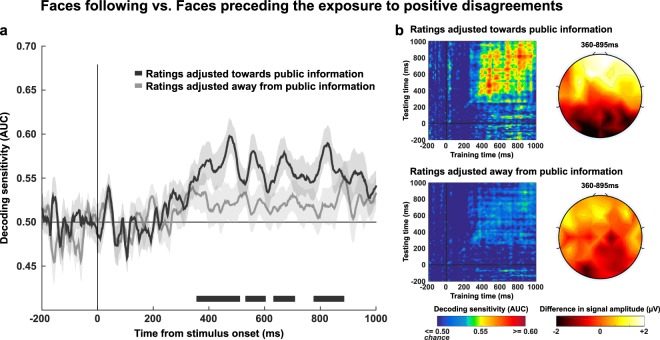
Figure 4.
Decoding stages of face processing as a function of subsequent rating adjustment. (a) Sensitivity of the decoders that were trained to classify faces presented before vs after a positive disagreement, and which resulted in a rating adjusted towards public information (black curve) or away from public information (light grey curve). Significant clusters are represented by the corresponding markers appearing at the bottom of the graphs. (b) The left panels depict the temporal generalization matrices of the decoders performance specific to trials resulting in ratings adjusted towards (upper panel) or away (lower panel) from public information. The diagonal (where testing time = training time) gives the curve for canonical decoders performance over time. The upper and lower right-hand panel represent the topographical maps of the differential EEG activity (faces following-preceding positive disagreements) recorded during trials resulting in ratings adjusted towards or away from public information, respectively. In both contrasts, the differential EEG activity was averaged across time-points composing the entire time-series which included the four clusters of significant decoding sensitivity (from 360 ms to 895 ms post-stimulus).

