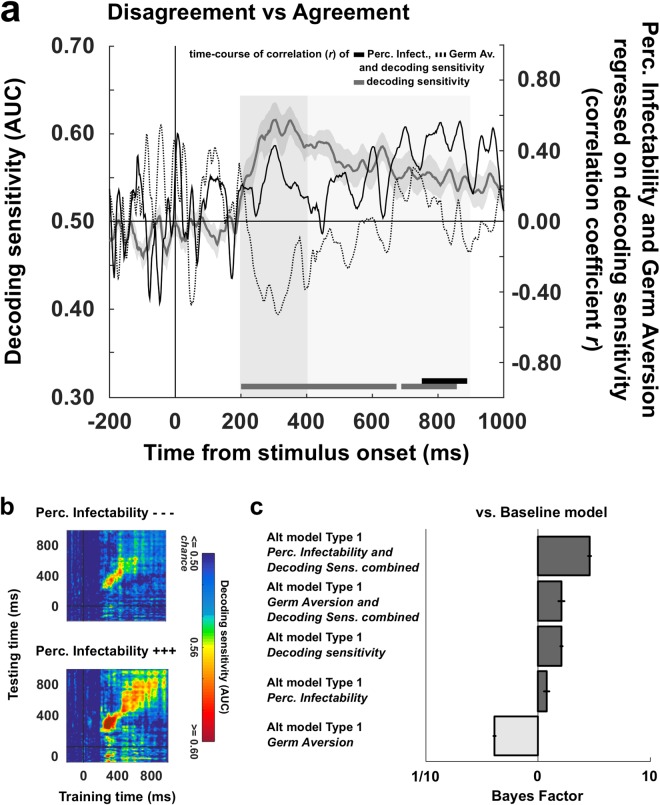
Figure 5.
Decoding stages of public information processing as a function of indicators of perceived vulnerability to extrinsic morbidity risks. (a) The solid and dotted black curves represent the time-course of correlation (coefficient r, right y axis) between decoding sensitivities of public information processing (grey curve, left y axis) and Perceived Infectability scores on the one hand (solid curve), and Germ Aversion scores on the other hand (dotted curve). Clusters of adjacent time-points in which the correlation coefficient r was >0.40 are represented by the corresponding markers located just above the x axis. (b) Temporal generalization of public information decoding obtained after splitting the participants sample into high and low scorers on the Perceived Infectability subscale (median split). The diagonal (where testing time = training time) gives the curve for canonical decoder performance over time. (c) Bayesian analyses of models with and without the index summing Perceived Infectability scores or Germ Aversion scores with decoding sensitivities, or each of these variables taken in isolation as predictor of social influence scores. The baseline model only includes disagreement valence and disagreement strength as within-subject factors; alternative models include the combination indices, decoding sensitivity, Perceived Infectability or Germ Aversion as a main effect (type 1). A Bayes Factor >1 indicates greater evidence for the alternative model.

