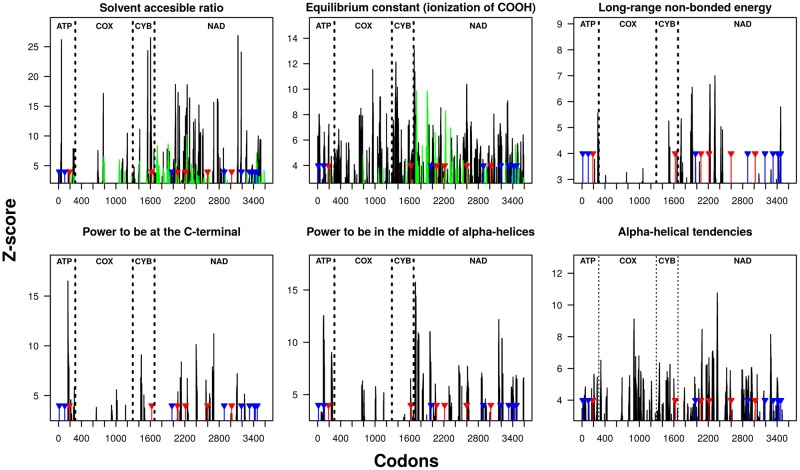
Fig. 10.
—Protein properties and residues inferred as likely to be under positive selection. The regions colored in black and green correspond to those with Z scores > 3.09 (P value < 0.01), susceptible of having undergone radical changes in each property as inferred from the TRESAAP analysis; sticks correspond to the sites likely to be under selection (blue: 0.90 < p < 0.95; red: p > 0.90) following Bayes empirical Bayes in PAML (see also fig. 7).

