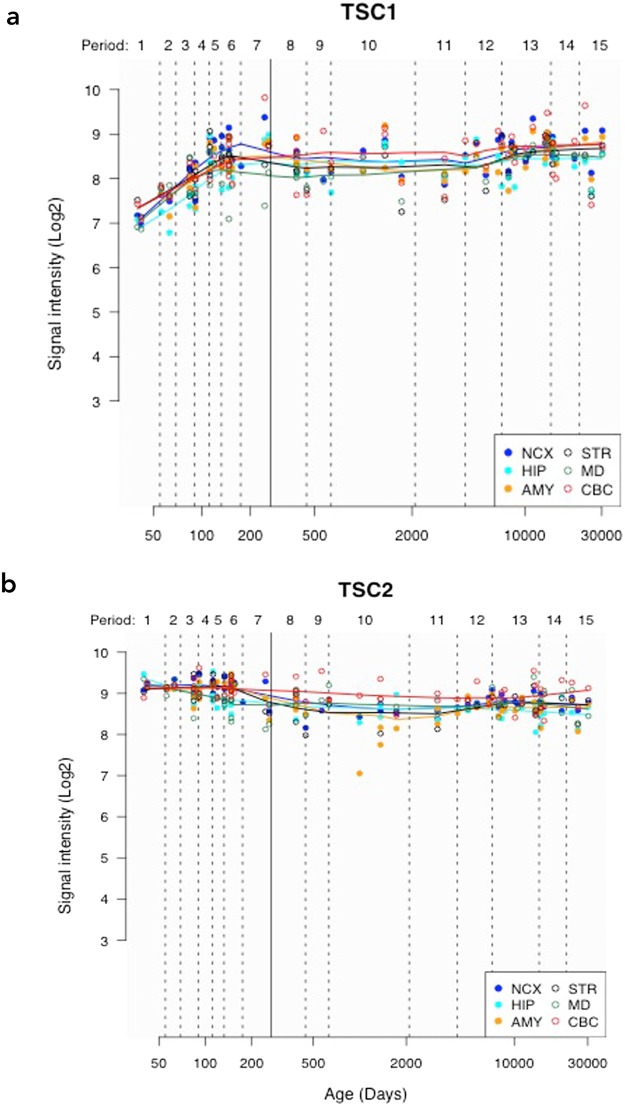
Figure 5.
Line plots showing TSC1 (a) and TSC2 (b) gene expression over time, using data from the Human Brain Transcriptome (http://hbatlas.org/). NCX = neocortex, MD = medial dorsal thalamus, CBC = cerebellar cortex, HIP = hippocampus, STR = striatum and AMY = amygdala. ‘Y-axis shows relative gene expression as Log2 signal intensity assessed from hybridization of cDNA generated from extracted RNA to Affymetrix Human Exon microarrays as detailed in Kang et al., Nature 2011. ‘Period’ refers to periods of human development and adulthood defined in that original paper and chosen to emphasize the timing and progression of major neurodevelopmental events in the Cerebral Cortex.’ X-axis shows post-conception age in days; the solid vertical line indicates the transition between pre-natal and post-natal periods.

