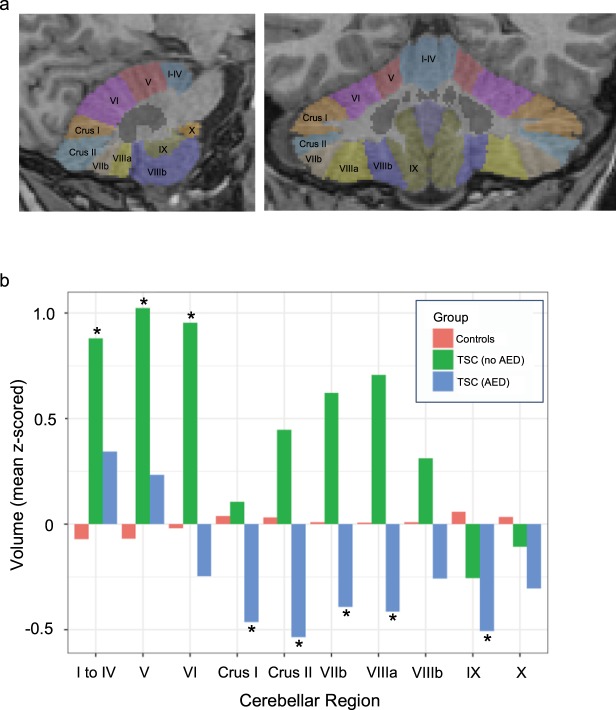
Figure 8.
(a) Sagittal (left) and Coronal (right) images of a representative subject’s brain showing individual cerebellar lobules segmented using the SUIT (‘spatially unbiased infra-tentorial template‘) software package33. (b) Bar graphs show mean volumes of each cerebellar region for each of 3 groups: Controls (red) (n = 200), TSC patients not taking anti-epileptic drugs (AEDs) green (n = 10), and TSC patients taking AEDs (blue) (n = 18). Volumes of each cerebellar region were z-scored across all subjects/groups before computing group averages. Asterisks (*) highlight regions/groups where TSC volumes differ significantly from those of the control group at a nominal p-value < 0.05 derived from a linear regression model of group effects that controls for age and gender (see Supplemental Table 1a,b for individual model results).

