Fig. 4.
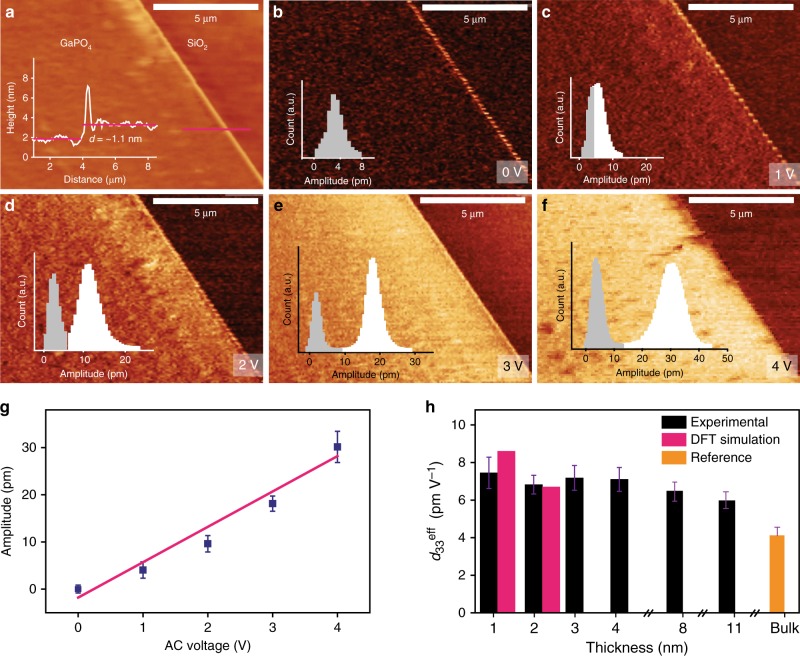
Characterisations of out of plane piezoelectricity of 2D GaPO4. a AFM topography of a unit cell thick GaPO4 nanosheet. b–f Vertical piezoresponse amplitude profiles at different AC driving voltages. The insets represent the statistical distribution of the piezoresponse amplitude variations of GaPO4 film (white colour) and the substrate (grey colour). g Average piezoresponse amplitude as a function of the applied AC voltage extracted from the statistical distributions of the amplitude variations of GaPO4 and the substrate. Error bars signify the standard deviations which are introduced to indicate uncertainty of the measurements. h Value of deff33 for GaPO4 films with different thicknesses. The bulk value for d33 is extracted from ref.49. Error bars signify the deviations of slope of piezoelectric amplitude for the driving bias voltage (AC) for experimental deff33. DFT simulations of 2D GaPO4 nanosheets of higher thicknesses are not reported due to difficulties with accuracy and energy convergence

