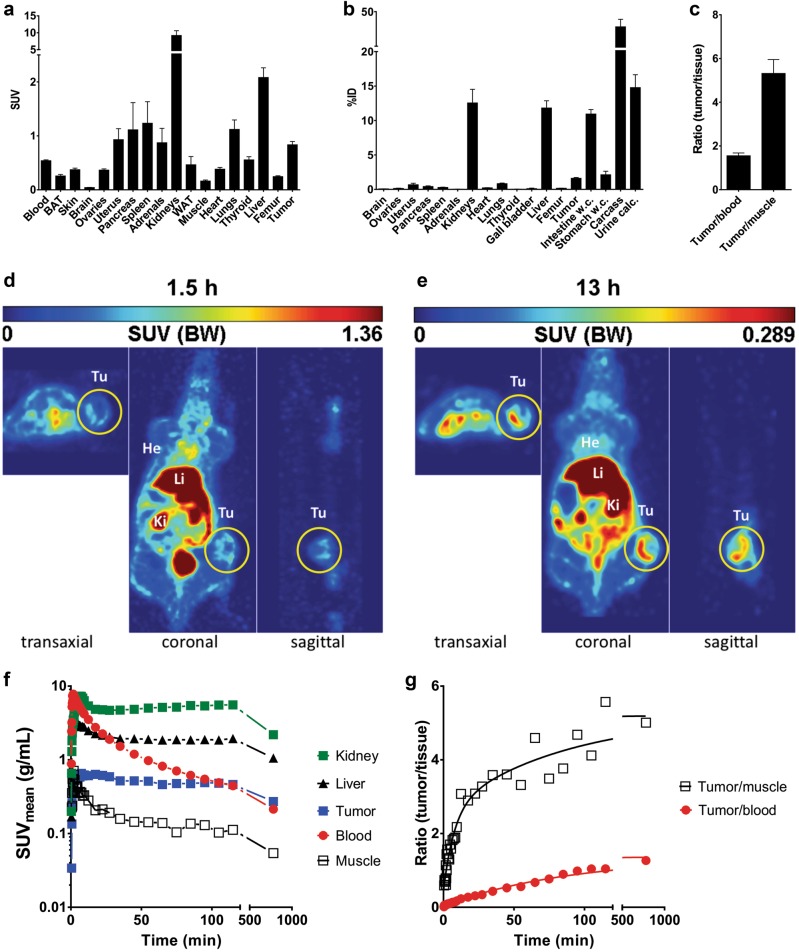
Fig. 2. Biodistribution, imaging, and time-activity curves of [64Cu]Cu-NODAGA-anti-STn TM in STn positive tumor bearing mice.
[64Cu]Cu-NODAGA-anti-STn TM was developed according to standard procedures7 and intravenously injected in NMRI-Foxn1nu/nu MDA-MB-231 STn-Luc tumor-bearing mice with 3–4 weeks of tumor growth (1.5 × 10⁶ cells, n = 4). Two hours after injection, the biodistribution of the [64Cu]Cu-NODAGA-anti-STn TM was measured and shown as activity concentration (SUV) (a) or percentage of the total activity of the injected dose %ID (b) in the selected organs and tissues. Target to background ratios including tumor to muscle-, and tumor to blood ratios are shown in (c). Values are represented as mean ± SEM. d, e Representative orthogonal images of a PET study at 1.5 h (d) and 13 h (e) after single intravenous injection of ~7 MBq [64Cu]Cu-NODAGA-anti-STn TM. f Time activity concentration curves of representative organs of an NMRI-Foxn1nu/nu mouse bearing an MDA-MB-231 STn-expressing tumor derived from a dynamic PET study over 2 h and a static at 13 h after single intravenous injection of ~7 MBq [64Cu]Cu-NODAGA-anti-STn TM. g Resulting target to background curves calculated as tumor to muscle and tumor to blood ratios

