Abstract
High failure rates of femoropopliteal artery (FPA) interventions are often attributed to severe mechanical deformations that occur with limb flexion. One of these deformations, cross-sectional pinching, has a direct effect on blood flow, but is poorly characterized. Intra-arterial markers were deployed into n = 50 in situ cadaveric FPAs (80 ± 12 years old, 14F/11M), and limbs were imaged in standing, walking, sitting and gardening postures. Image analysis was used to measure marker openings and calculate FPA pinching. Parametric finite element analysis on a stent section was used to determine the optimal combination of stent strut amplitude, thickness and the number of struts per section to maximize cross-sectional opening and minimize intramural mechanical stress and low wall shear stress. Pinching was higher distally and increased with increasing limb flexion. In the walking, sitting and gardening postures, it was 1.16–1.24, 1.17–1.26 and 1.19–1.35, respectively. Stent strut amplitude and thickness had strong effects on both intramural stresses and pinching. Stents with a strut amplitude of 3 mm, thickness of 175 µm and 20 struts per section produced pinching and intramural stresses typical for a non-stented FPA, while also minimizing low wall shear stress areas, and ensuring a stent lifespan of at least 107 cycles. These results can help guide the development of improved devices and materials to treat peripheral arterial disease.
Keywords: femoropopliteal artery, pinching, limb flexion, intra-arterial markers, stent, design
1. Introduction
Peripheral arterial disease (PAD) often manifests as an atherosclerotic obstruction of the femoropopliteal artery (FPA), reducing blood flow to the lower limbs. It is a major public health burden and is associated with significant costs [1] because of the high numbers of peripheral vascular operations and interventions that fail, resulting in poor clinical outcomes and a frequent need for repetitive interventions [2–5].
A significantly higher frequency of FPA reinterventions compared with other arterial beds, such as carotid or iliac arteries, suggests that the local mechanical environment of the FPA plays a significant role in its pathophysiology [6]. Surrounded by powerful muscles, the FPA experiences severe mechanical deformations with limb flexion that include axial compression [7], bending [7,8], twisting [9] and cross-sectional pinching. These deformations and the associated forces acting cyclically with each limb flexion can ultimately injure the arterial wall, producing deleterious cellular and biochemical responses, and culminating in disease development, progression and reconstruction failure [6,8,10–14]. Understanding the magnitude of these deformations and the associated forces is particularly important for the design of materials and devices used in PAD repair, as these devices need to withstand the severity of the mechanical environment in the lower limb.
Several prior studies have used in vivo imaging [15–17] to quantify limb flexion-induced deformations of the leg artery, but these measurements often relied on arterial side branches that tether the FPA to the surrounding tissues, thereby restricting deformations and resulting in significantly underestimated results [6,8]. Other studies have used stents [18–21] to assess deformations of the FPA, but because different stents affect baseline deformations differently [21–23], these results may be applicable only to a particular device that was used to perform measurements. In addition, intricate stent patterns significantly complicate independent measurements of FPA deformation modes because many devices demonstrate coupled compression/bending/twisting/pinching behaviour [21,23].
To overcome these limitations, a new approach using a perfused human cadaver model was successfully implemented to measure limb flexion-induced axial compression, bending and twisting of the FPA with limb flexion and extension [7–9,21]. In this approach, a custom-designed intra-arterial marker system and clinical computerized tomography (CT) imaging was used to spatially track the FPA in different limb flexion postures corresponding to normal daily activities of standing, walking, sitting and gardening. Intra-arterial markers had no sizable effect on limb flexion-induced deformations [9,21], but allowed their accurate and repeatable measurements without relying on arterial side branches. Using this technique, recent studies reported axial compression [7], bending [7] and twisting [9] of the FPA with limb flexion, but the method also allows direct assessment of cross-sectional pinching—a characteristic that has a paramount effect on blood flow but has not yet been evaluated in previous studies and is therefore poorly understood.
Characterization of limb flexion-induced pinching of the FPA is particularly important for treatment of heavily calcified lesions [24] in arterial segments that experience significant deformations and require stents that can maintain an open lumen during acute bending of the artery. While making a stiff device that would remain open is fairly straightforward, the trade-off is high intramural stresses that such a device would chronically introduce to the arterial wall [25,26], thereby disrupting the healing process and potentially worsening clinical outcomes. In this study, we performed a parametric computational analysis to determine the optimal combination of stent strut amplitude, thickness, number of struts per section and length of interconnectors to maximize the cross-sectional opening of the artery during limb flexion while maintaining the baseline intramural stress level, ensuring adequate fatigue performance of the stent and minimizing low pathogenic wall shear stress.
2. Methods
2.1. Human cadaver model and assessment of femoropopliteal artery pinching
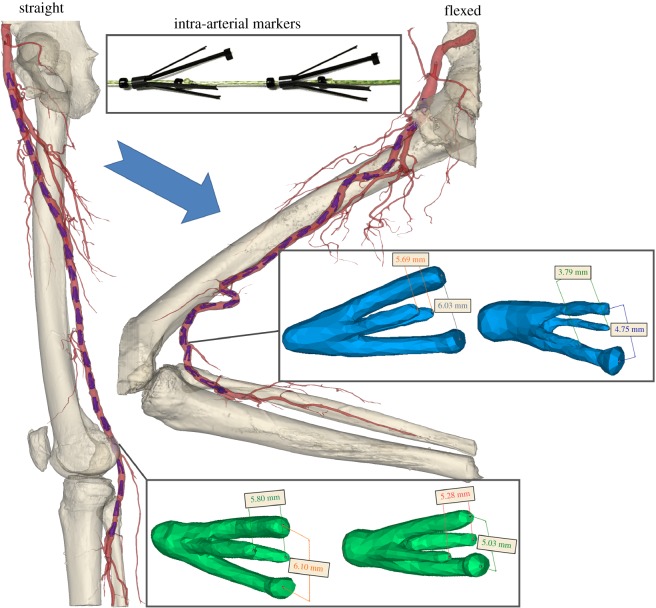
Custom-made four-legged intra-arterial markers were laser-cut from nitinol tubes and heat-set to the shape depicted in the insert of figure 1. Two of the four legs were longer, and one of the long legs had extra material at the tip for easy identification of marker orientation on imaging. The markers were designed to exert the same small radial force on both the long and the short pairs of legs, which was achieved by varying the length and width of these legs.
Figure 1.
Perfused human cadaver model in straight (standing) and flexed (gardening) postures with inserted intra-arterial markers. Differences between openings of the long and short pairs of marker legs in the straight (green) and flexed (blue) postures were used to determine radial displacements associated with limb flexion.
The hollow head of each marker allowed them to be placed on a string for easy delivery and retrieval. Two sets of markers, each containing 22 devices spaced 2 cm apart, were made and validated in silicone tubes to ensure that markers maintained their position during tube deformations without sliding along the lumen [9]. Each set of markers was then compressed and loaded into a 6-French plastic tube for minimally invasive delivery into the cadaveric FPA (figure 1).
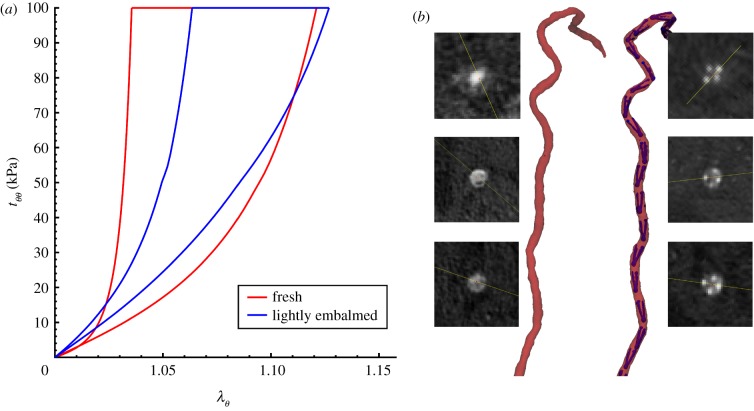
Markers were deployed under fluoroscopic guidance into n = 50 limbs of 25 perfused lightly embalmed human cadavers (80 ± 12 years old, 14 female, 11 male, no peripheral artery interventions, no aneurysmal disease and no metal prostheses that can interfere with CT imaging). The use of human cadavers is not considered human subjects research, and did not require Institutional Review Board approval. Light embalming [27] with glutaraldehyde-based solution as opposed to formaldehyde-based solution allowed preservation of natural tissue elasticity, which was verified by performing tensile mechanical testing [28–30] and comparing data with similarly aged fresh FPAs [21,31,32] (figure 2a).
Figure 2.
(a) Comparison of FPA mechanical properties for lightly embalmed arteries used in this study versus fresh FPAs of similar-aged subjects [31,32]. Data are presented for the circumferential direction as circumferential stretch ( ) plotted versus Cauchy stress (
 , kPa). (b) Representative CT angiography image of the FPA in the gardening posture before and after deployment of intra-arterial markers. Inserts illustrate cross-sectional views of the artery taken along the centreline at various FPA segments. Figure demonstrates no measurable influence of markers on limb flexion-induced FPA deformations. Bones are not plotted for better visualization. (Online version in colour.)
Details of the intra-arterial marker deployment method and its validation are provided in our previous works [7,9,21], but the technique was designed to maintain the integrity of the anatomical structures surrounding the FPA while providing a sufficient number of radiopaque reference points for accurate characterization of FPA deformations. Arteries were perfused with the Harvard Apparatus Large Animal pump (Harvard Apparatus, Holliston, MA) using a 37°C radiopaque custom mixture fluid containing calcium carbonate to avoid tissue swelling. CT images (GE Light Speed VCTXT scanner; GE Healthcare, Waukesha, USA) were obtained with limbs in the standing (180o), walking (110o), sitting (90o) and gardening (60o) postures, and used to measure openings between the long and short legs of each marker in each limb flexion state using the Mimics (Materialize Co., Leuven, Belgium) software. All measurements were acquired by a single operator to reduce variability.
Deployment of intra-arterial markers had no measurable effect on limb flexion-induced FPA deformations [21], which was verified by imaging the artery before and after marker deployment (figure 2b). For the FPA presented in figure 2b, average pinching without the markers was 1.129 ± 0.13 (range 1.009–1.431) and with the markers 1.130 ± 0.13 (range 1.004–1.458), and a paired two-tailed t-test demonstrated no difference between the two cases (p = 0.93).
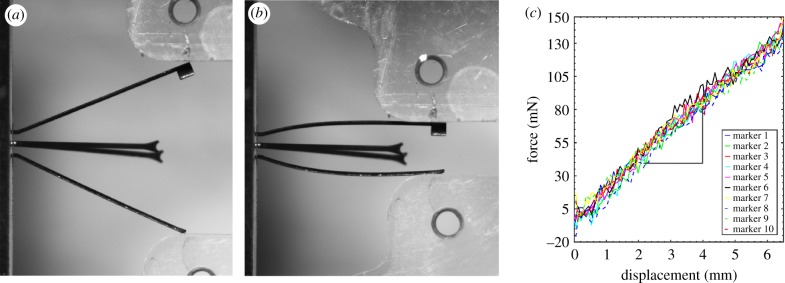
To further characterize the amount of radial force that markers exerted on the FPA wall, 10 markers were randomly selected from the batch and tested under uniaxial compression using a CellScale Biotester equipped with a 5 N loadcell. During the test the head of each marker was fixed between the clamps on one axis of the Biotester, and compressive displacement was applied on another axis (figure 3a,b). Loading–unloading force–displacement curves (figure 3c) were fitted with a line equation using Matlab (MathWorks, Natick, MA, USA), which produced a measure of marker stiffness k that related displacements to force, and allowed assessment of the local radial force associated with limb flexion in each marker in situ by measuring the difference between marker openings in the straight and flexed limb postures and multiplying the result by k = 21.6 ± 1.3 mN mm−1.
Figure 3.
Uniaxial compression of an intra-arterial marker (a,b) was used to determine its force–displacement characteristics (c). Graphs on (c) represent properties of 10 different markers that allowed calculation of marker stiffness k = 21.6 ± 1.3 mN mm−1. (Online version in colour.)
Marker openings were also used to assess pinching of the FPA by calculating the ratios of largest to smallest openings (figure 1). Comparison of these openings in all flexed limb postures with those in the straight limb posture allowed measurement of limb flexion-induced change in cross-sectional diameter, i.e. the  ratio, which will be further referred to as compression. Here, d and D are marker openings (i.e. FPA diameters) in the flexed and straight postures, respectively, that were measured for both short and long pairs of marker legs (figure 1). As many FPA cross sections were skewed, we have selected the smallest
  ratio between the long and short pairs of marker legs to represent the most severe compression in a given FPA segment. Change in cross-sectional area along the length of the FPA was assessed as the area of the ellipse with major and minor axes represented by marker openings.
Finally, the FPA along its length was divided into the superficial femoral artery (SFA), spanning from the profunda femoris (PF) artery take-off to the adductor hiatus (AH), and the popliteal artery (PA), which spanned from the AH to the tibioperoneal trunk (TPT). The centre of the AH was defined using the anterior projection view to locate the point at which the FPA crosses the femur, and the length of the AH was assumed to occupy the last and first 10% of the SFA and PA lengths, respectively. Maximum pinching, most severe compression and forces occurring in each of the three FPA segments were calculated for each limb in each posture. Pearson's correlation coefficient r was used to assess the strength of correlations with age. The hypothesis of no correlation was tested against the alternative that there is a non-zero correlation assuming statistical significance at p < 0.05. When appropriate, paired two-tailed t-tests with statistical significance set at p < 0.05 were used to assess differences between two groups.
2.2. Influence of stent design on femoropopliteal artery pinching, intramural stresses and fatigue performance
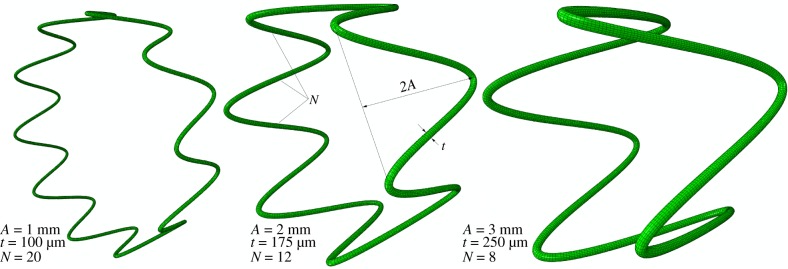
Finite element analysis (FEA) was used to study how FPA pinching is affected by different stent designs. A generic 7 mm diameter sine-wave stent section with a circular cross section was parametrically constructed using Python scripting in Abaqus 2017 CAE (Simulia; Dassault Systemes, Waltham, MA), taking advantage of the model symmetry to reduce computational cost. Three geometric parameters were varied to change stent characteristics, including strut amplitude (A = 1, 2, 3 mm), strut thickness (t = 100 µm, 175 µm, 250 µm) and the number of struts per stent section (N = 8, 12, 20) (figure 4), resulting in a total of 27 models. The stent was modelled using a superelastic material model for nitinol available in Abaqus with two different sets of material properties adopted from Gökgöl et al. [33] and Kleinstreuer et al. [34]. For convenience these parameters are summarized in table 1.
Figure 4.
Three representative stent designs with different strut amplitudes (A), strut thicknesses (t) and number of struts per stent section (N). (Online version in colour.)
Table 1.
| Gökgöl et al. [33] | Kleinstreuer et al. [34] | |
|---|---|---|
austenite elastic modulus  , MPa , MPa |
65 000 | 51 700 |
austenite Poisson's ratio 
|
0.33 | 0.3 |
martensite elastic modulus  , MPa , MPa |
23 500 | 47 800 |
martensite Poisson's ratio 
|
0.33 | 0.3 |
transformation strain 
|
0.046 | 0.063 |
start of transformation loading  , MPa , MPa |
465 | 600 |
end of transformation loading  , MPa , MPa |
535 | 670 |
start of transformation unloading  , MPa , MPa |
227 | 288 |
end of transformation unloading  , MPa , MPa |
187 | 254 |
start of transformation stress in compression  , MPa , MPa |
582 | 900 |
volumetric transformation strain 
|
0.046 | 0.063 |
density  , g cm−3 , g cm−3
|
6.5 | 6.5 |
The arterial segment was modelled as a tube with an inner diameter of 6 mm and wall thickness of 1.1 mm typical for human FPA. Axial loading was not simulated because during limb flexion FPAs undergo axial compression [7] that releases most of the axial tension [29]. A two-fibre family Holzapfel–Gasser–Ogden constitutive model [35] with  parameters corresponding to a 60–70 year old artery [32,36] were used to describe the mechanical behaviour of the arterial wall. Compressibility was simulated by setting the ratio of the initial bulk modulus to the shear modulus at
  , and arterial density was assumed to be 1 g cm−3. The tube was filled with a soft and near incompressible material to simulate the effects of blood in supporting the wall during bending. Linear elastic material was used to simulate the filling, and the elastic modulus was set to 0.1 kPa with a Poisson's ratio of 0.499 producing a 1.41 pinching ratio during bending—an upper limit of FPA pinching observed in the cadaver experiments.
Prior to deployment into the artery, the stent was crimped using a rigid tubular catheter meshed with surface elements SFM3D4R with 7 g cm−3 density. The ends of the artery were constrained to move as rigid bodies guided by reference points, and equal and opposite rotations of 90° were prescribed to these reference points, followed by distance adjustment to produce a bent configuration. The stent was then deployed accounting for the contact between the stent and the inner arterial surface using a general contact algorithm with a friction coefficient of 0.4. To reduce oscillations during stent deployment, a small viscous pressure of 0.01 kPa was applied to the inner surface of the wall. The amount of viscous pressure was chosen such that it eliminated oscillations yet did not affect arterial deformation. Finally, the stabilization step was performed to allow the stent–artery system to equilibrate. During all steps, loading rates and time increments were chosen to keep the kinetic energy within 5% of the internal energy of the system. Mesh sensitivity analyses for the stent and the arterial wall were performed to ensure mesh-independent results in terms of maximum principal strains and von Mises stresses, respectively.
Stent designs and material parameters were compared in terms of the degree of arterial pinching they produced, measured as the ratio of the long to short axes of the elliptical cross section; in terms of the maximum principal strains in the stent; and in terms of the average intramural von Mises stress in the region that involved the stent and 1 mm of artery on both sides of the stent. Finally, the stent fatigue safety factor (FSF) for each design was assessed based on the nitinol endurance limit of 0.4% [37], and stent strain amplitude  calculated as the difference between deployed stents in straight and bent FPA configurations at any given integration point as
  [38].
[38].
2.3. Influence of stent design on wall shear stress
Computational fluid dynamics (CFD) analysis was performed to assess the effects of different stent designs on FPA haemodynamics. The inner surface of the bent and stented FPA segment was extracted from Abaqus, and the volume mesh was created using the 3Matic (Materialize Co., Leuven, Belgium) software. CFD analysis was performed using the Abaqus 2016 CFD solver (Simulia; Dassault Systemes, Waltham, MA), modelling blood as a Newtonian fluid with a viscosity of 0.0035 Pa s and density of 1.05 g cm−3 [39]. Inflow boundary conditions were adopted from Patel et al. [40] and represented a typical femoral artery pulsatile waveform. A zero pressure condition was imposed at the outlet of the artery, and two cardiac cycles were simulated [39]. Time averaged wall shear stress (TAWSS) was calculated to asses FPA haemodynamics using the last computed cardiac cycle. Mesh convergence was achieved with respect to a less than 5% difference in area with pathological TAWSS, which was defined as TAWSS less than or equal to 0.4 Pa [41].
2.4. Effect of axial interconnections on femoropopliteal artery pinching and intramural stresses
The best performing stent section design chosen based on intramural stress and haemodynamics analyses was used to make a 20–24 mm device by connecting several stent sections with axial links. Two interconnector lengths were used, one short (1 mm) and one long (3 mm), to study the effect of connector length on FPA stresses and pinching. FE models were constructed and analysed using Abaqus 2017 as described above in §2.2. As stent models were no longer symmetric due to the presence of links, the analysis employed full stent and arterial geometries.
3. Results
3.1. Pinching and cross-sectional area in each arterial segment
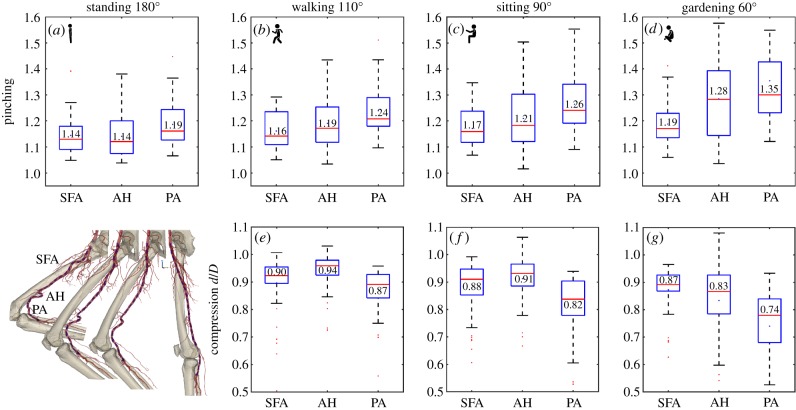
Cross-sectional pinching of the FPA in different segments and limb postures is demonstrated in figure 5a–d. The central red line in each box indicates the median, and the bottom and top edges indicate the 25th and 75th percentiles. Mean values are represented with blue dots inside the box. The whiskers extend to the most extreme data points not considered to be outliers, and the outliers are plotted using the red dot and are found as  , where
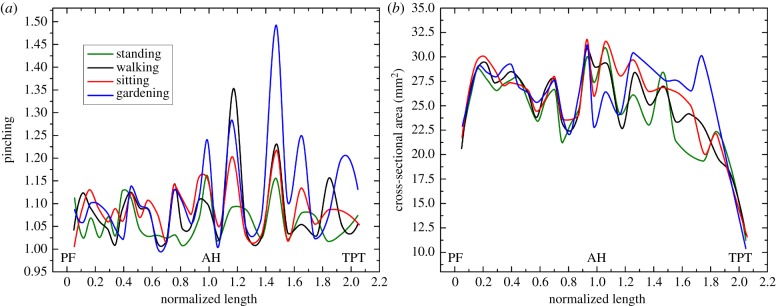
  are the 25th and 75th percentiles, respectively. Whiskers correspond to approximately ±2.7 standard deviation or 99.3% coverage. The cross section of the FPA was not circular even in the standing posture with 1.14–1.19 major to minor axis ratios and more elliptical cross sections observed distally (figure 5a). Limb flexion resulted in more pinched cross sections (p < 0.01) in all postures and arterial segments, and the increase was largest for the PA. Within the arterial segments pinching changed non-uniformly with peaks around the AH and in the PA below the knee where the artery also demonstrated severe bending [7,8] (figure 1). Representative variation in cross-sectional pinching along the length of the FPA is presented in figure 6a.
Figure 5.
Pinching (a–d) and compression ratio  (e–g) in the standing (a), walking (b,e), sitting (c,f) and gardening (d,g) postures for the superficial femoral artery (SFA), adductor hiatus (AH) and popliteal artery (PA) segments. Data represent maximum pinching and the smallest
  ratio observed in each segment. Boxes extend to the 25th and 75th percentiles; the median is marked with a red horizontal line, and mean values are marked with a blue dot. (Online version in colour.)
Figure 6.
Change in cross-sectional pinching (a) and area (b) along the normalized length of the FPA for a representative subject in the standing, walking, sitting and gardening postures. PF, profunda femoris artery; AH, adductor hiatus; TPT, tibioperoneal trunk. Note increase in cross-sectional pinching with more acute limb flexion occurring primarily around and distal to the AH where the artery also experiences severe bending. (Online version in colour.)
The most severe compression represented by the smallest  ratios observed in the FPA in the walking, sitting and gardening postures is presented in figure 5e–g. The ratio was smaller than 1 during limb flexion in all segments and all postures (p < 0.01). In the SFA, mean compression ranged from 0.90 to 0.87, at the AH 0.94 to 0.83 and in the PA 0.87 to 0.74, with more severe compression occurring in more flexed limb postures (p < 0.01). Overall, the largest (i.e. the most severe) compression was 0.53 and it was measured in the PA in the gardening posture.
In the walking posture, the FPA experienced more compression in the SFA than at the AH (p < 0.01), but compression in the PA was higher than in the SFA (p = 0.02). The same was true for the sitting posture (p = 0.02, p < 0.01), but not for the gardening posture. In the gardening posture, the largest compression was also observed in the PA (p < 0.01), but compression at the AH was higher than in the SFA (r = 0.04). No correlations were observed between compression and age.
Despite changes in pinching and compression, the cross-sectional area of the entire FPA did not change significantly from standing to walking and sitting postures (p = 0.07 and p = 0.13, respectively), but decreased in the gardening posture (p < 0.01). Average cross-sectional areas of the SFA, AH and PA in the standing posture were 20.18 ± 7.86 mm2, 20.38 ± 9.36 mm2 and 16.75 ± 6.46 mm2, respectively. In the gardening posture, these values decreased to 20.00 ± 7.78 mm2, 18.57 ± 8.45 mm2 and 15.23 ± 6.14 mm2, respectively. Representative variation in cross-sectional area along the length of the FPA in all four postures is presented in figure 6b.
Radial forces associated with limb flexion were relatively small and were in the range 12–15 mN in the SFA, 6–19 mN at the AH and 12–28 mN in the PA with higher values observed at more acute limb flexions.
3.2. Effect of stent design on femoropopliteal artery pinching, intramural stresses and stent fatigue performance
Effects of different stent designs on arterial pinching during limb flexion-induced bending and the associated average intramural von Mises stresses are illustrated in figure 7. Here the colour of the markers represents stent strut amplitude, while shape refers to different strut thicknesses. Arrows depict the increase in the number of struts per stent section. The average cross-sectional ratio of the artery without the stent in the standing posture is marked with a red vertical line drawn at 1.16 (figure 5a). In an acutely flexed limb, this ratio can be as high as 1.41 (figure 5d), which is marked with a star symbol and a horizontal blue line that marks the baseline intramural von Mises stress associated with bending in figure 7. Two sets of nitinol material parameters resulted in average differences of 0.8% and 1.9% in terms of pinching and average intramural von Mises stresses, respectively, and maximum differences reached 1.5% and 4.4%. Results below are presented for nitinol parameters adopted from Gökgöl et al. [33].
Figure 7.
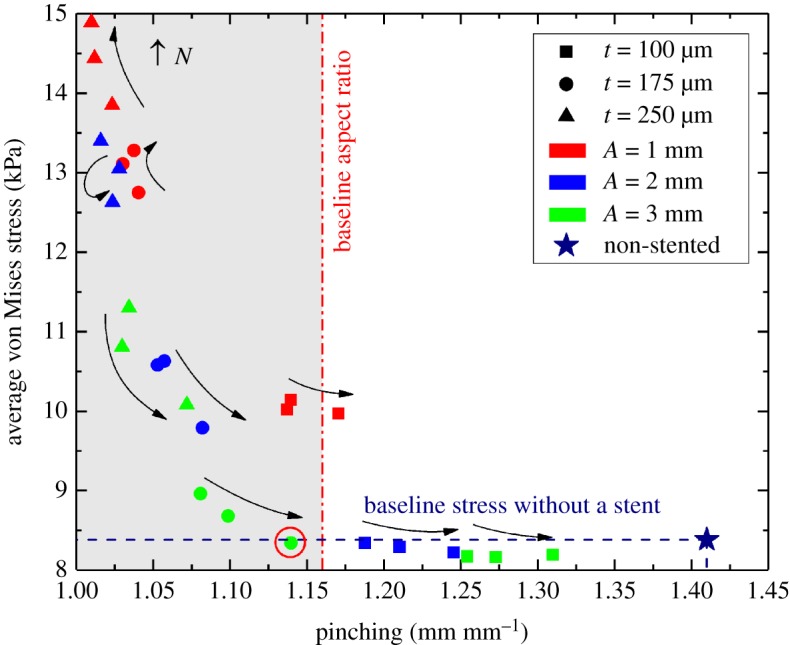
Effects of stent strut amplitude (A), strut thickness (t) and the number of struts per stent section (N) on arterial pinching and average intramural von Mises stresses (kPa). Colour represents the stent strut amplitude, shape refers to different strut thicknesses and arrows depict the increase in the number of struts per stent section. Baseline pinching (1.41) and intramural stresses (8.4 kPa) in an acutely flexed artery without a stent are marked with a star symbol. The baseline average cross-sectional ratio for the non-stented FPA in the straight limb is marked with a vertical red line drawn at 1.16. Optimal stent design is marked with a red circle. (Online version in colour.)
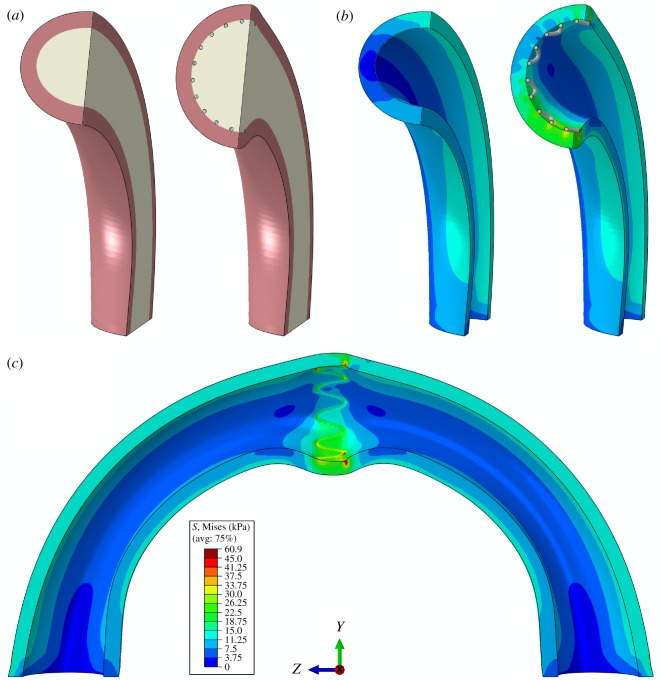
Illustration of how stenting affects FPA pinching, changing it from 1.41 at baseline to 1.01 with the stent, is demonstrated in figure 8. Here, figure 8a illustrates the model of the artery and the inner body representing blood in a cross-sectional view before and after stenting, and figure 8b shows intramural von Mises stresses (kPa) in the same sections when the inner body is removed for better visualization. Figure 8c depicts intramural stresses due to stenting in the bent artery in the longitudinal view, illustrating high stress concentrations at the outer and inner bends.
Figure 8.
(a) Three-dimensional model of the bent FPA without and with the stent, and (b) the associated intramural von Mises stresses (kPa). In (b), the inner body representing the fluid is removed for better visualization. (c) Longitudinal view of the stented FPA demonstrating high stress concentrations at the outer and inner bends. Stent is removed for better visualization of its stress imprint in the arterial wall. (Online version in colour.)
Figure 7 demonstrates that strut amplitude and thickness had the strongest effects on both intramural stresses and pinching. Thicker struts produced less pinching but higher intramural stresses, and similar results were observed for strut amplitude. The number of struts per stent section had a weaker effect, with the increase in the number of struts producing smaller intramural stresses and more severe pinching. Interestingly, in the case of very stiff stents depicted in the upper left corner of figure 7, the effect was reversed, and intramural stresses were higher for stents with more struts per cross section, while pinching was largely unaffected and the artery remained practically circular with the diameter close to the stent nominal size.
A stent with a strut amplitude of 3 mm, strut thickness of 175 µm and 20 struts per section produced a pinching of 1.14 (which is close to the average cross-sectional ratio of the non-stented FPA in the straight limb), while maintaining the baseline non-stented intramural von Mises stress level. Though it was possible to achieve an even more round FPA stented lumen in the acutely flexed limb, this was associated with significantly higher intramural stresses, particularly in designs that used short and thick stent struts.
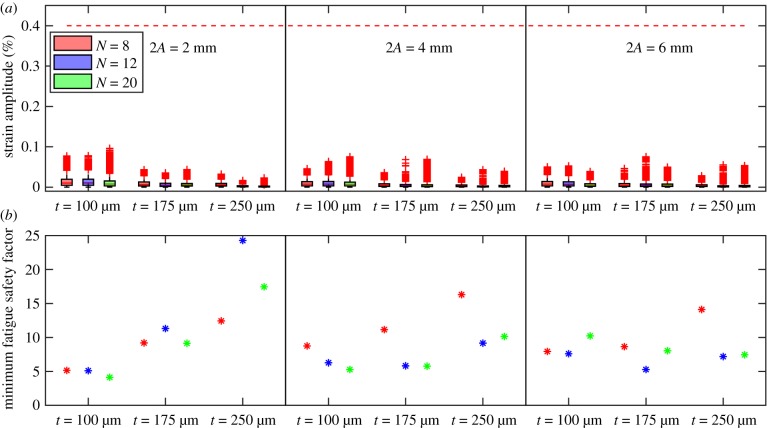
Stent strain amplitudes and FSF calculated as differences between bent and straight configurations are shown in figure 9. Figure 9a demonstrates box plots of strain amplitudes for each stent design and each integration point. All stents demonstrated much lower strain amplitude than the nitinol endurance limit of 0.4%, shown in the graph as a red line, which suggests a lifespan of at least 107 cycles. Mean strains mostly ranged from −0.4% to 0.4% for all devices. The smallest FSF calculated for each stent design is demonstrated in figure 9b. A minimum FSF of 4.1 was observed for the stent with A = 1 mm, t = 100 µm and N = 20, which suggests that this design was more prone to failure due to fatigue. In all designs, failure was more likely to occur at stent apexes where higher strain amplitudes and higher von Mises stresses tended to localize.
Figure 9.
(a) Strain amplitudes for each stent design and each integration point. Nitinol endurance limit of 0.4% that corresponds to the lifespan of 107 cycles is marked with a horizontal red line. (b) Smallest fatigue safety factor (FSF) for each stent design. (Online version in colour.)
3.3. Effect of stent design on femoropopliteal artery haemodynamics
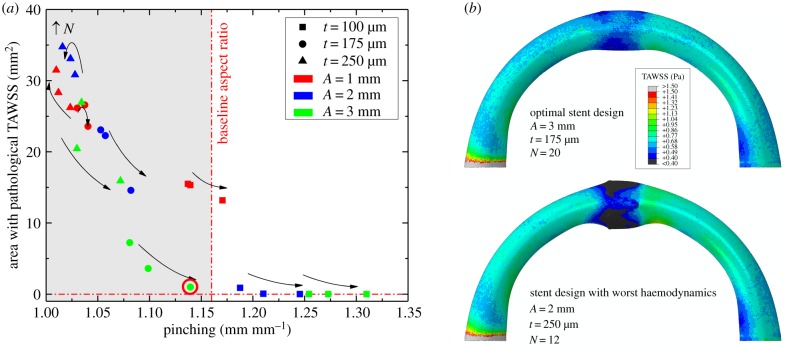
The effect of stent design on the area of pathological TAWSS (less than or equal to 0.4 Pa) as a function of arterial pinching is demonstrated in figure 10a. Overall, TAWSS demonstrated similar trends to the intramural stresses presented in figure 7. In particular, strut amplitude and thickness had the strongest effect on haemodynamics, with stents that had shorter and thicker struts producing larger areas of pathological TAWSS. Though less important than amplitude and thickness, the increase in the number of struts resulted in smaller areas of low TAWSS. As observed previously with stresses, the latter trend was reversed for stiff stent designs depicted in the upper left corner of figure 10a.
Figure 10.
(a) Effects of stent strut amplitude (A), strut thickness (t) and the number of struts per stent section (N) on the area of pathological TAWSS of less than or equal to 0.4 Pa [41]. Colour represents the stent strut amplitude, shape refers to different strut thicknesses and arrows depict the increase in the number of struts per stent section. (b) Time-averaged wall shear stress (TAWSS) distribution in the artery repaired with optimal stent design (top) compared with the stent design that produced the worst haemodynamics (bottom).
The optimal stent design characteristics that were chosen based on stress and pinching analyses produced a pathological TAWSS area of 1 mm2, which again was the optimal choice that allowed the baseline pinching ratio of 1.16 to be preserved. Figure 10b demonstrates TAWSS in the artery repaired with this optimal design (3 mm strut amplitude, 175 µm strut thickness and 20 struts), and compares it with the stent that produced the largest area of pathological TAWSS (2 mm strut amplitude, 250 µm strut thickness and 12 struts).
3.4. Effect of axial interconnections on femoropopliteal artery pinching and stresses
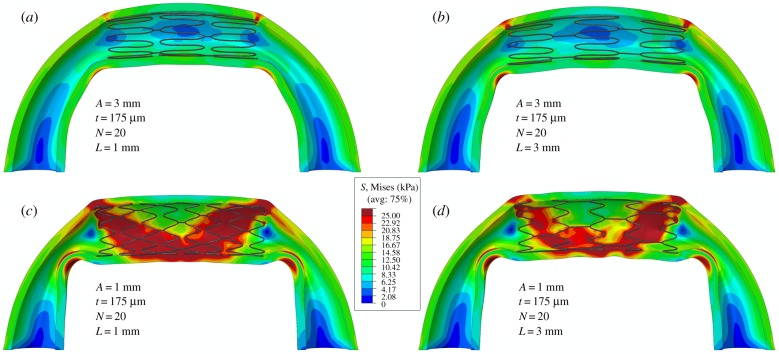
The best performing stent design with A = 3 mm, t = 175 µm and N = 20 was used to create a stent section by interconnecting three rings with L = 1 mm and L = 3 mm axial connectors. Figure 11a,b demonstrates that average von Mises stresses and pinching were the same for arteries with both lengths of axial interconnections and averaged 4 kPa and 1.04, respectively. Peak stresses and pinching of the artery outside of the stented segment were somewhat higher for the stent with longer axial connectors, with von Mises stresses of 37 kPa versus 30 kPa and pinching of 2.34 versus 1.98.
Figure 11.
Intramural von Mises stresses in the artery repaired with stents that have axial interconnector lengths of L = 1 mm (a,c) and L = 3 mm (b,d). Results are presented for stents with long, i.e. A = 3 mm (a,b), and short, i.e. A = 1 mm (c,d), struts.
To understand if similar trends were observed for stiffer stents with shorter struts, similar calculations were performed for rings with A = 1 mm but the same strut thickness, number of struts and link sizes. Results presented in figure 11c,d demonstrate that stiffer stents with longer axial connectors demonstrate lower intramural stresses and slightly less pinching outside of the stented area than stents with shorter axial interconnectors.
4. Discussion
The FPA is a dynamic artery in the lower limb that experiences complex deformations with limb flexion, which include axial compression, bending, twisting and cross-sectional pinching. The severity of axial compression, bending and twisting has recently been demonstrated using a perfused human cadaver model [7–9], and was speculated to contribute to poor clinical outcomes of open and endovascular PAD repairs [6]. The focus of the current study was to characterize cross-sectional pinching of the FPA during limb flexion because it has a direct effect on blood flow, and to determine optimal stent design parameters that maximize stented cross-sectional area while minimizing intramural stresses.
Our data demonstrate that the FPA cross section deforms significantly with limb flexion, achieving on average 0.75 and a minimum 0.53 compression ratio in the gardening posture. These deformations are associated with significant pinching of the FPA and an increase in its cross-sectional aspect ratio from 1.14 to 1.19 in the standing posture to 1.19–1.35 in the gardening posture, with a maximum of 1.41 at the 75th percentile. In addition, compression ratios decrease with increasing limb flexion angle, and are non-uniformly distributed along the length of the artery, achieving lowest values distally in the PA below the knee where the artery experiences severe bending [7].
Pinching of the FPA with limb flexion is poorly described in the literature. One computational study by Ghriallais & Bruzzi [42] reported a minimum lumen aspect ratio of 0.24 in the sitting posture, which is equivalent to 4.2 pinching as defined here. Authors have also reported average cross-sectional areas of straight and flexed limbs of 37.9 mm2 and 28.3 mm2, respectively, which allow calculation of the average arterial diameter in the straight limb (6.9 mm), and long and short diameters of the elliptical cross section in the flexed limb (12.3 mm and 2.9 mm, respectively). This corresponds to the  ratio of 2.9/6.9 = 0.42, which is smaller than the 0.53 minimum ratio reported here. The discrepancy can stem from the choice of boundary conditions and material properties in the computational model by Ní Ghriallais & Bruzzi [42], and may also be attributed to buckling of the hollow tube that they used to model the FPA.
Another study that described cross-sectional pinching of the FPA was performed by Brown et al. [43], but measurements were obtained only in the straight limb posture under isometric thigh contraction. They reported a change in the cross-sectional aspect ratio from 1.14 in the relaxed thigh state to 1.30 in the contracted state with the cross-sectional area remaining approximately constant, which corresponds to the  associated with active muscle contraction. Cross-sectional pinching measured in our cadaver model agrees well with values obtained in a relaxed thigh demonstrating a 1.14–1.19 FPA aspect ratio in the straight limb. The increase in cross-sectional pinching with muscle contraction observed by Brown et al. [43] suggests that pinching reported here can be even more severe in vivo when the shape of the artery is affected by the powerful muscles of the limb.
Finally, several recent studies have used stents to characterize FPA pinching during limb flexion [21,44], and have associated pinching with bending deformations. Furthermore, they have demonstrated appreciable differences in pinching produced by the intricacies of different stent designs [21], and reported pinching in the range of 1.03–1.34 with an average of 1.18 ± 0.11 across seven different devices. This large discrepancy in values and their dependence on device patterns suggest that, in order to inform future stent designs, baseline pinching should be assessed in non-stented FPAs.
Measurements of baseline FPA pinching can potentially be performed in vivo, but it is challenging to identify the same arterial locations along the length of the artery, and the same pairs of long and short axes in all cross sections as the artery progresses through the limb flexion states. The intra-arterial marker technique helps mitigate these challenges and allows straightforward measurement of baseline arterial pinching in the same arterial locations across all postures, but it can only be used in cadaver models that cannot account for active muscle contraction. Further analysis using patient data in different limb flexion states to supplement cadaver data can provide useful insights on the effects of active muscle contraction on FPA deformations through inverse methods and computational modelling. In the meantime, the data provided can inform stent design to maximize cross-sectional opening in the acutely bent limb while minimizing intramural stresses and ensuring adequate fatigue life.
Our analysis demonstrates that this goal is achievable when using a large number of long medium-thickness stent struts. The stent with these parameters produced cross-sectional ratios typical for a straight limb posture, kept intramural stresses at the baseline non-stented level and was able to minimize areas with pathological low wall shear stress. In addition, this design appeared to maintain adequate fatigue life and could be used with either short or long axial interconnectors that produced similar results in terms of intramural stresses and pinching.
While these results are promising, it is important to remember that current analysis did not include the effects of atherosclerotic plaques that significantly influence stent–artery interaction. Specifically, stiff calcified lesions may require stents with higher radial force to maintain an open lumen, which may require shorter and thicker struts that come at the expense of higher intramural stresses. As demonstrated here, in this case the use of longer axial interconnectors appears beneficial as they can help reduce intramural stresses while maintaining luminal opening.
Similar results with respect to computational stent design optimization have been reported previously [45,46], also indicating that longer struts and axial interconnectors reduce intramural stresses and result in less intimal hyperplasia [25,45]. While the list of stent design features considered here is quite small, in the future this analysis can be augmented by including more design characteristics and other deformation modes to develop devices with fine-tuned patient- and segment-specific performance. Such studies will build on the body of existing stent optimization work [26,33,45–53], and will use data on human FPA mechanical properties in different age and risk-factor groups and information on limb flexion-induced deformations [6–9,21,23,24,28–32]. We envisage that such parametric analyses can become versatile tools in developing new-generation FPA stents that would have optimized mechanical and clinical performance.
Data accessibility
This article has no additional data.
Authors' contributions
W.P., J.M. and A.K. performed limb flexion experiments. W.P. performed image analysis. A.D. performed mechanical characterization and computational modelling. A.D., A.K. and K.M. participated in data analysis and interpretation. A.K., A.D. and W.P. drafted the manuscript. J.M. and K.M. helped to revise the manuscript. A.K. and J.M. conceived, designed and coordinated the study. All the authors gave their final approval for publication.
Competing interests
We declare we have no competing interests.
Funding
Research reported in this publication was supported in part by the National Heart, Lung, and Blood Institute of the National Institutes of Health under award nos. R01 HL125736 and F32 HL124905.
References
- 1.Mahoney EM, et al. 2008. One-year costs in patients with a history of or at risk for atherothrombosis in the United States. Circ. Cardiovasc. Qual. Outcomes 1, 38–45. ( 10.1161/CIRCOUTCOMES.108.775247) [DOI] [PubMed] [Google Scholar]
- 2.Adam DJ, et al. 2005. Bypass versus angioplasty in severe ischaemia of the leg (BASIL): multicentre, randomised controlled trial. Lancet 366, 1925–1934. ( 10.1016/S0140-6736(05)67704-5) [DOI] [PubMed] [Google Scholar]
- 3.Conte MS, et al. 2006. Results of PREVENT III: a multicenter, randomized trial of edifoligide for the prevention of vein graft failure in lower extremity bypass surgery. J. Vasc. Surg. 43, 742–751. ( 10.1016/j.jvs.2005.12.058) [DOI] [PubMed] [Google Scholar]
- 4.Schillinger M, Sabeti S, Loewe C. 2006. Balloon angioplasty versus implantation of nitinol stents in the superficial femoral artery. N. Engl. J. Med. 354, 1879–1888. [DOI] [PubMed] [Google Scholar]
- 5.Schillinger M, et al. 2007. Sustained benefit at 2 years of primary femoropopliteal stenting compared with balloon angioplasty with optional stenting. Circulation 115, 2745–2749. ( 10.1161/CIRCULATIONAHA.107.688341) [DOI] [PubMed] [Google Scholar]
- 6.Maleckis K, Anttila E, Aylward P, Poulson W, Desyatova A, MacTaggart J, Kamenskiy A. 2018. Nitinol stents in the femoropopliteal artery: a mechanical perspective on material, design, and performance. Ann. Biomed. Eng. 46, 684–704. ( 10.1007/s10439-018-1990-1) [DOI] [PMC free article] [PubMed] [Google Scholar]
- 7.Poulson W, Kamenskiy A, Seas A, Deegan P, Lomneth C, MacTaggart J. 2017. Limb flexion-induced axial compression and bending in human femoropopliteal artery segments. J. Vasc. Surg. 67, 607–613 ( 10.1016/j.jvs.2017.01.071) [DOI] [PMC free article] [PubMed] [Google Scholar]
- 8.MacTaggart JN, et al. 2014. Three-dimensional bending, torsion and axial compression of the femoropopliteal artery during limb flexion. J. Biomech. 47, 2249–2256. ( 10.1016/j.jbiomech.2014.04.053) [DOI] [PubMed] [Google Scholar]
- 9.Desyatova A, Poulson W, Deegan P, Lomneth C, Seas A, Maleckis K, MacTaggart J, Kamenskiy A. 2017. Limb flexion-induced twist and associated intramural stresses in the human femoropopliteal artery. J. R. Soc. Interface 14, 20170025 ( 10.1098/rsif.2017.0025) [DOI] [PMC free article] [PubMed] [Google Scholar]
- 10.Clowes AW, Reidy MA, Clowes MM. 1983. Mechanisms of stenosis after arterial injury. Lab. Invest. 49, 208–215. [PubMed] [Google Scholar]
- 11.Wensing PJW, Meiss L, Mali WPTM, Hillen B. 1998. Early atherosclerotic lesions spiraling through the femoral artery. Arterioscler. Thromb. Vasc. Biol. 18, 1554–1558. ( 10.1161/01.ATV.18.10.1554) [DOI] [PubMed] [Google Scholar]
- 12.Dunlop GR, Santos R. 1957. Adductor-canal thrombosis. N. Engl. J. Med. 256, 577–580. ( 10.1056/NEJM195703282561301) [DOI] [PubMed] [Google Scholar]
- 13.Palma EC. 1959. Hemodynamic arteriopathy. Angiology 10, 134–143. [DOI] [PubMed] [Google Scholar]
- 14.Watt J. 1965. Origin of femoro-popliteal occlusions. Br. Med. J. 2, 1455–1459. [DOI] [PMC free article] [PubMed] [Google Scholar]
- 15.Gökgöl C, Diehm N, Kara L, Büchler P. 2013. Quantification of popliteal artery deformation during leg flexion in subjects with peripheral artery disease: a pilot study. J. Endovasc. Ther. 20, 828–835. ( 10.1583/13-4332MR.1) [DOI] [PubMed] [Google Scholar]
- 16.Cheng CP, Choi G, Herfkens RJ, Taylor CA. 2010. The effect of aging on deformations of the superficial femoral artery resulting from hip and knee flexion: potential clinical implications. J. Vasc. Interv. Radiol. 21, 195–202. ( 10.1016/j.jvir.2009.08.027) [DOI] [PMC free article] [PubMed] [Google Scholar]
- 17.Cheng C, Wilson N, Hallett R. 2006. In vivo MR angiographic quantification of axial and twisting deformations of the superficial femoral artery resulting from maximum hip and knee flexion. J. Vasc. Interv. Radiol. 17, 979–987. ( 10.1097/01.RVI.0000220367.62137.E8) [DOI] [PubMed] [Google Scholar]
- 18.Nikanorov A, Schillinger M, Zhao H, Minar E, Schwartz LB. 2013. Assessment of self-expanding nitinol stent deformation after chronic implantation into the femoropopliteal arteries. EuroIntervention 9, 730–737. ( 10.4244/EIJV9I6A117) [DOI] [PubMed] [Google Scholar]
- 19.Ganguly A, Simons J, Schneider A, Keck B, Bennett NR, Herfkens RJ, Coogan SM, Fahrig R. 2011. In-vivo imaging of femoral artery nitinol stents for deformation analysis. J. Vasc. Interv. Radiol. 22, 244–249. ( 10.1016/j.jvir.2010.10.019) [DOI] [PubMed] [Google Scholar]
- 20.Schumann S, Gökgöl C, Diehm N, Büchler P, Zheng G. 2017. Effect of stent implantation on the deformations of the superficial femoral artery and popliteal artery: in vivo three-dimensional deformational analysis from two-dimensional radiographs. J. Vasc. Interv. Radiol. 28, 142–146. ( 10.1016/j.jvir.2016.04.023) [DOI] [PubMed] [Google Scholar]
- 21.MacTaggart J, Poulson W, Seas A, Deegan P, Lomneth C, Desyatova A, Maleckis K, Kamenskiy A. 2018. Stent design affects femoropopliteal artery deformation. Ann. Surg. 1 ( 10.1097/SLA.0000000000002747) [DOI] [PMC free article] [PubMed] [Google Scholar]
- 22.Ní Ghriallais R, Heraty K, Smouse B, Burke M, Gilson P, Bruzzi M. 2016. Deformation of the femoropopliteal segment: effect of stent length, location, flexibility, and curvature. J. Endovasc. Ther. 23, 907–918. ( 10.1177/1526602816669135) [DOI] [PubMed] [Google Scholar]
- 23.Maleckis K, et al. 2017. Comparison of femoropopliteal artery stents under axial and radial compression, axial tension, bending, and torsion deformations. J. Mech. Behav. Biomed. Mater. 75, 160–168. ( 10.1016/j.jmbbm.2017.07.017) [DOI] [PMC free article] [PubMed] [Google Scholar]
- 24.Kamenskiy A, Poulson W, Sim S, Reilly A, Luo J, MacTaggart J. 2018. Prevalence of calcification in human femoropopliteal arteries and its association with demographics, risk factors, and arterial stiffness. Arterioscler. Thromb. Vasc. Biol. 38, ATVBAHA.117.310490 ( 10.1161/ATVBAHA.117.310490) [DOI] [PMC free article] [PubMed] [Google Scholar]
- 25.Timmins LH, Miller MW, Clubb FJ, Moore JE. 2011. Increased artery wall stress post-stenting leads to greater intimal thickening. Lab. Invest. 91, 955–967. ( 10.1038/labinvest.2011.57) [DOI] [PMC free article] [PubMed] [Google Scholar]
- 26.Berry JL, et al. 2002. Hemodynamics and wall mechanics of a compliance matching stent: in vitro and in vivo analysis. J. Vasc. Interv. Radiol. 13, 97–105. [DOI] [PubMed] [Google Scholar]
- 27.Wadman MC, Lomneth CS, Hoffman LH, Zeger WG, Lander L, Walker RA. 2010. Assessment of a new model for femoral ultrasound-guided central venous access procedural training: a pilot study. Acad. Emerg. Med. 17, 88–92. ( 10.1111/j.1553-2712.2009.00626.x) [DOI] [PubMed] [Google Scholar]
- 28.Kamenskiy A, Pipinos I, Dzenis Y, Lomneth C, Kazmi SAJ, Phillips N, MacTaggart J. 2014. Passive biaxial mechanical properties and in vivo axial pre-stretch of the diseased human femoropopliteal and tibial arteries. Acta Biomater. 10, 1301–1313. ( 10.1016/j.actbio.2013.12.027) [DOI] [PMC free article] [PubMed] [Google Scholar]
- 29.Kamenskiy A, Seas A, Bowen G, Deegan P, Desyatova A, Bohlim N, Poulson W, MacTaggart J. 2016. In situ longitudinal pre-stretch in the human femoropopliteal artery. Acta Biomater. 32, 231–237. ( 10.1016/j.actbio.2016.01.002) [DOI] [PMC free article] [PubMed] [Google Scholar]
- 30.Kamenskiy AV, Pipinos II, Dzenis YA, Phillips NY, Desyatova AS, Kitson J, Bowen R, MacTaggart JN. 2015. Effects of age on the physiological and mechanical characteristics of human femoropopliteal arteries. Acta Biomater. 11, 304–313. ( 10.1016/j.actbio.2014.09.050) [DOI] [PubMed] [Google Scholar]
- 31.Desyatova A, MacTaggart J, Kamenskiy A. 2017. Constitutive modeling of human femoropopliteal artery biaxial stiffening due to aging and diabetes. Acta Biomater. 64, 50–58. ( 10.1016/j.actbio.2017.09.042) [DOI] [PMC free article] [PubMed] [Google Scholar]
- 32.Kamenskiy A, Seas A, Deegan P, Poulson W, Anttila E, Sim S, Desyatova A, MacTaggart J. 2017. Constitutive description of human femoropopliteal artery aging. Biomech. Model. Mechanobiol. 16, 681–692. ( 10.1007/s10237-016-0845-7) [DOI] [PMC free article] [PubMed] [Google Scholar]
- 33.Gökgöl C, Diehm N, Nezami FR, Büchler P. 2015. Nitinol stent oversizing in patients undergoing popliteal artery revascularization: a finite element study. Ann. Biomed. Eng. 43, 2868–2880. ( 10.1007/s10439-015-1358-8) [DOI] [PubMed] [Google Scholar]
- 34.Kleinstreuer C, Li Z, Basciano CA, Seelecke S, Farber MA. 2008. Computational mechanics of nitinol stent grafts. J. Biomech. 41, 2370–2378. [DOI] [PubMed] [Google Scholar]
- 35.Holzapfel GA, Gasser TC, Ogden RW. 2000. A new constitutive framework for arterial wall mechanics and a comparative study of material models. J. Elast. 61, 1–48. [Google Scholar]
- 36.Desyatova A, MacTaggart J, Poulson W, Deegan P, Lomneth C, Sandip A, Kamenskiy A. 2017. The choice of a constitutive formulation for modeling limb flexion-induced deformations and stresses in the human femoropopliteal arteries of different ages. Biomech. Model. Mechanobiol. 16, 775–785. ( 10.1007/s10237-016-0852-8) [DOI] [PMC free article] [PubMed] [Google Scholar]
- 37.Pelton AR, Schroeder V, Mitchell MR, Gong X-Y, Barney M, Robertson SW. 2008. Fatigue and durability of nitinol stents. J. Mech. Behav. Biomed. Mater. 1, 153–164. [DOI] [PubMed] [Google Scholar]
- 38.Robertson SW, Pelton AR, Ritchie RO. 2012. Mechanical fatigue and fracture of nitinol. Int. Mater. Rev. 57, 1–37. ( 10.1179/1743280411Y.0000000009) [DOI] [Google Scholar]
- 39.Desyatova A, MacTaggart J, Romarowski R, Poulson W, Conti M, Kamenskiy A. 2018. Effect of aging on mechanical stresses, deformations, and hemodynamics in human femoropopliteal artery due to limb flexion. Biomech. Model. Mechanobiol. 17, 181–189. ( 10.1007/s10237-017-0953-z) [DOI] [PMC free article] [PubMed] [Google Scholar]
- 40.Patel DJ, Greenfield JC, Austen WG, Morrow AG, Fry DL. 1965. Pressure-flow relationships in the ascending aorta and femoral artery of man. J. Appl. Physiol. 20, 459–463. [DOI] [PubMed] [Google Scholar]
- 41.Malek AM, Alper SL, Izumo S. 1999. Hemodynamics shear stress and its role in atherosclerosis. JAMA 282, 2035–2042. [DOI] [PubMed] [Google Scholar]
- 42.Ní Ghriallais R, Bruzzi M. 2013. Effects of knee flexion on the femoropopliteal artery: a computational study. Med. Eng. Phys. 35, 1620–1628. ( 10.1016/j.medengphy.2013.05.015) [DOI] [PubMed] [Google Scholar]
- 43.Brown R, Nguyen TD, Spincemaille P, Prince MR, Wang Y. 2009. In vivo quantification of femoral-popliteal compression during isometric thigh contraction: assessment using MR angiography. J. Magn. Reson. Imaging 29, 1116–1124. ( 10.1002/jmri.21700) [DOI] [PMC free article] [PubMed] [Google Scholar]
- 44.Smouse BHB, Nikanorov A, Laflash D. 2005. Biomechanical forces in the femoropopliteal arterial segment. Endovasc. Today 4, 60–66. [Google Scholar]
- 45.Bedoya J, Meyer CA, Timmins LH, Moreno MR, Moore JE. 2006. Effects of stent design parameters on normal artery wall mechanics. J. Biomech. Eng. 128, 757 ( 10.1115/1.2246236) [DOI] [PubMed] [Google Scholar]
- 46.Timmins LH, Meyer CA, Moreno MR, Moore JE. 2008. Effects of stent design and atherosclerotic plaque composition on arterial wall biomechanics. J. Endovasc. Ther. 15, 643–654. ( 10.1583/08-2443.1) [DOI] [PMC free article] [PubMed] [Google Scholar]
- 47.McGrath DJ, O'Brien B, Bruzzi M, McHugh PE. 2014. Nitinol stent design—understanding axial buckling. J. Mech. Behav. Biomed. Mater. 40, 252–263. ( 10.1016/j.jmbbm.2014.08.029) [DOI] [PubMed] [Google Scholar]
- 48.Petrini L, et al. 2016. A computational approach for the prediction of fatigue behaviour in peripheral stents: application to a clinical case. Ann. Biomed. Eng. 44, 536–547. ( 10.1007/s10439-015-1472-7) [DOI] [PubMed] [Google Scholar]
- 49.Alaimo G, Auricchio F, Conti M, Zingales M. 2017. Multi-objective optimization of nitinol stent design. Med. Eng. Phys. 47, 13–24. ( 10.1016/j.medengphy.2017.06.026) [DOI] [PubMed] [Google Scholar]
- 50.Early M, Kelly DJ. 2011. The consequences of the mechanical environment of peripheral arteries for nitinol stenting. Med. Biol. Eng. Comput. 49, 1279–1288. ( 10.1007/s11517-011-0815-2) [DOI] [PubMed] [Google Scholar]
- 51.García A, Peña E, Martínez MA. 2012. Influence of geometrical parameters on radial force during self-expanding stent deployment. Application for a variable radial stiffness stent. J. Mech. Behav. Biomed. Mater. 10, 166–175. ( 10.1016/j.jmbbm.2012.02.006) [DOI] [PubMed] [Google Scholar]
- 52.Hara H, Nakamura M, Palmaz JC, Schwartz RS. 2006. Role of stent design and coatings on restenosis and thrombosis. Adv. Drug Deliv. Rev. 58, 377–386. ( 10.1016/j.addr.2006.01.022) [DOI] [PubMed] [Google Scholar]
- 53.Holzapfel GA, Stadler M, Gasser TC. 2005. Changes in the mechanical environment of stenotic arteries during interaction with stents: computational assessment of parametric stent designs. Trans. ASME 127, 166–180. ( 10.1115/1.1835362) [DOI] [PubMed] [Google Scholar]
Associated Data
This section collects any data citations, data availability statements, or supplementary materials included in this article.
Data Availability Statement
This article has no additional data.


