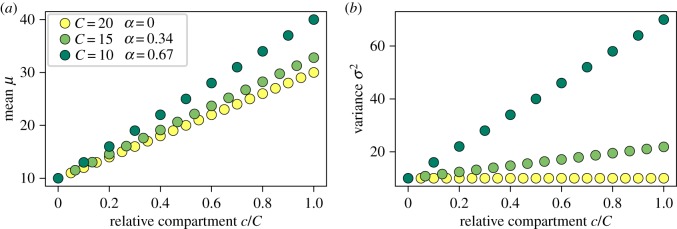
Figure 5.
Mean μ and variance σ2 of replicative age distributions per compartment. Influx age distribution is the Poisson distribution with a mean and variance of λ = 10 as in figure 3c; the x-axis shows the progression through the compartments c/C. To compare different tissue structures, the self-renewal parameter α is adjusted for the same output of cells as in figure 2. (a) The mean of replicative age increases slightly faster for high self-renewal. (b) The variance of replicative age increases also linearly, however, the impact of the self-renewal parameter α is much more pronounced: for α = 0, there is no change, but for α = 0.67, there is a drastic increase of the standard deviation per compartment. (Online version in colour.)

