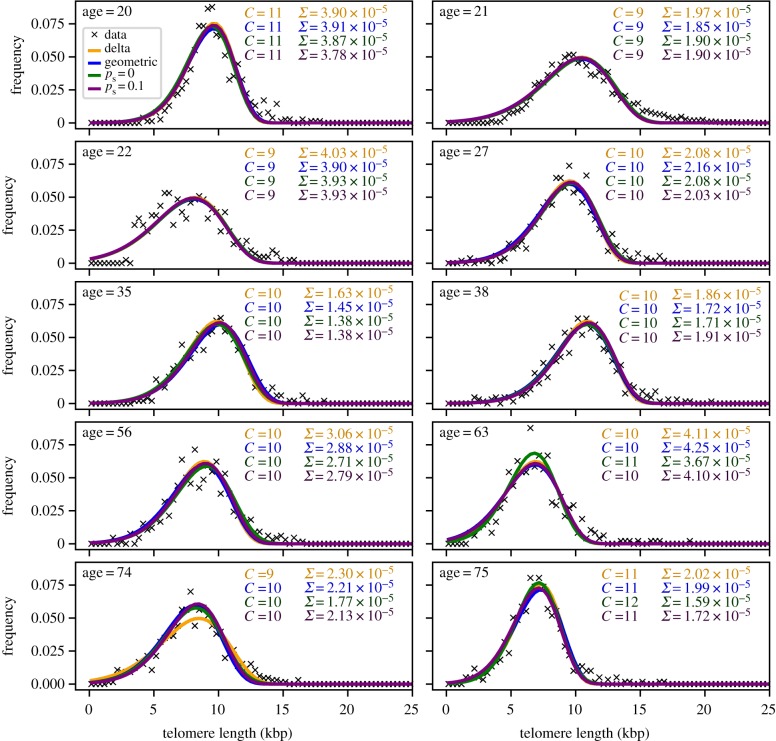
Figure 6.
Comparison of our model to telomere length distributions from human granulocytes. Previously published telomere length distributions from Werner et al. [18], where details of the experimental procedures are given. We compare the fits for four different influx distributions as shown in figure 3a–d: delta influx distribution, geometric influx distribution, and influx according to the stem cell model discussed in §3.1.3 with and without symmetric self-renewal adjusted to the age of the person. We assume a loss of 100 base pairs of telomeric DNA per cell division. We fit our model by varying the total number of compartments C and the initial telomere length, while fixing the self-renewal parameter α according to equation (2.4) such that we obtain the same total outflux from the last compartment Ω = 2.1 × 10¹⁰ cells d−1. Each panel also shows the best fit parameter C and the mean squared error Σ—which gives the quality of the fit—for each influx distribution separately. (Online version in colour.)

