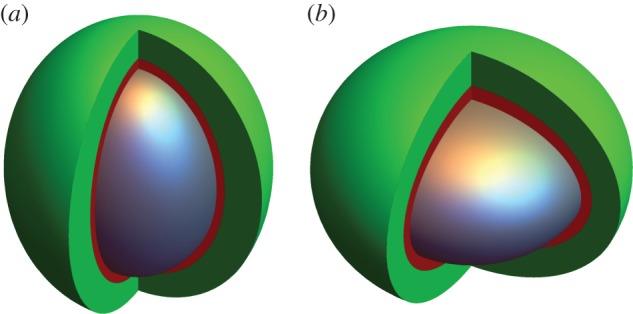
Figure 2.

(a) Prolate spheroid and (b) oblate spheroid. The anoxic central core in both cases (e = 0.75) is depicted in grey, and the hypoxic extent in red, while well-oxygenated cells are shown in green. Both ellipsoids have the same volume necrotic core, but their resultant oxygen distributions are slightly different. See text for discussion.
