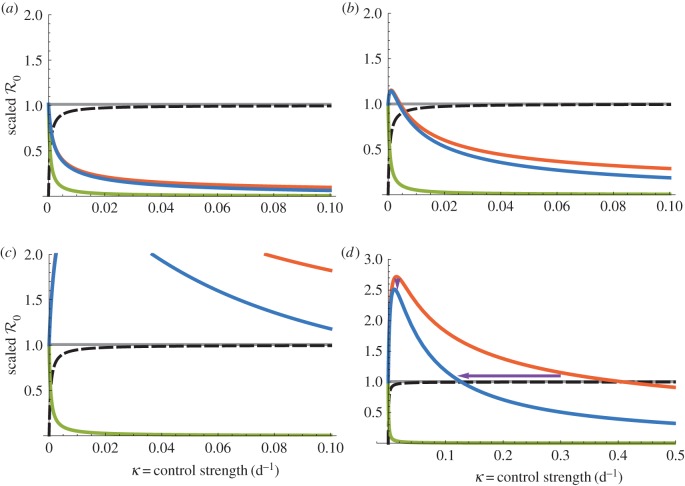
Figure 3.
Dependencies of  on bed net (1/γ = 5 years) control strength for the dynamic two-class model (blue), static two-class model (red) and one-class model (green). Corresponding equilibrium proportions of protected hosts are given by the dashed black curve. Suppressions in amplification severity and occurrence range are indicated by vertical and horizontal purple arrows, respectively, in (d). (a) Density-dependent infection ANh = 0.1 d−1, (b) moderate infection ANh = 1.0 d−1, (c) frequency-dependent infection ANh = 10.0 and (d) frequency-dependent infection (wide view).

