
Figure 6.
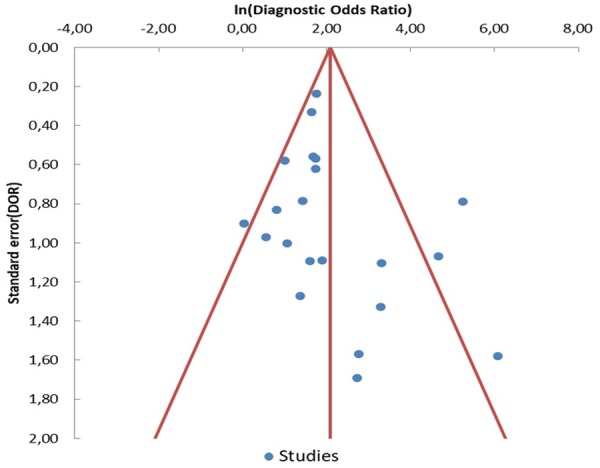
Funnel plot of diagnostic odds ratio (DOR) for ctDNA detection of EGFR-T790M mutation. Each study is represented by one circle- the vertical line represents the pooled effect estimate.
Official websites use .gov
A
.gov website belongs to an official
government organization in the United States.
Secure .gov websites use HTTPS
A lock (
) or https:// means you've safely
connected to the .gov website. Share sensitive
information only on official, secure websites.
Funnel plot of diagnostic odds ratio (DOR) for ctDNA detection of EGFR-T790M mutation. Each study is represented by one circle- the vertical line represents the pooled effect estimate.