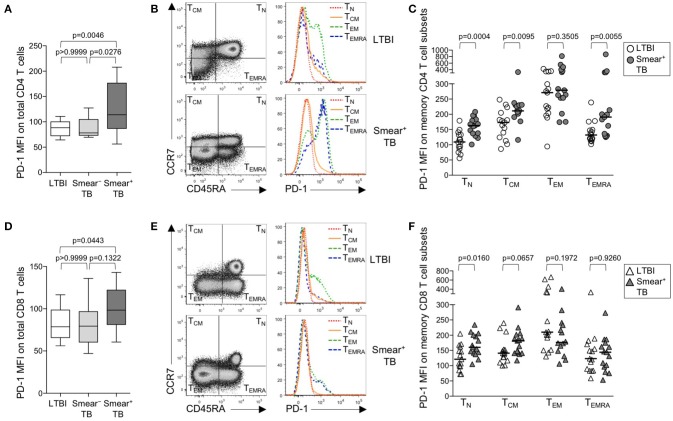
Figure 1.
PD-1 is upregulated on naïve and memory CD4 T cell subsets in patients with smear+ TB disease. PD-1 expression was measured by flow cytometry using whole blood samples obtained from individuals with LTBI (n = 33), and patients with smear− TB (n = 12) and with smear+ TB (n = 29). The MFI of PD-1 expression is shown on the total CD4 T cell population (A) and the total CD8 T cell population (D). PD-1 expression on naïve and memory CD4 and CD8 T cell subsets was performed on a subset of individuals with LTBI (n = 15) and patients with smear+ TB (n = 15). Representative flow cytometry data are shown of the naïve and memory T cell profile of CD4 T cells (B) and CD8 T cells (E) from an individual with LTBI (top row) and a patient with smear+ TB (bottom row). The flow cytometry data in (B) are gated on viable CD3+CD4+ lymphocytes; the flow cytometry data shown in (E) are gated on viable CD3+CD8+ lymphocytes. TN, TCM, TEM, and TEMRA subsets are indicated in each quadrant, according to expression of CCR7 and CD45RA. A histogram overlay of PD-1 expression by each T cell subset (TN, TCM, TEM, and TEMRA) is shown on the right. Composite data are shown indicating PD-1 MFI on naïve and memory CD4 (C) and CD8 T cell subsets (F). Horizontal lines represent the median. Differences between the three groups in (A, D) were assessed using a Kruskal-Wallis test; the p-values shown have been adjusted for multiple comparisons using Dunn's post-test. Differences between two groups in (C, F) were assessed using the Mann-Whitney test. For the box and whiskers plots in (A, D), the horizontal line represents the median, the boxes the interquartile range, and the whiskers the 10th and 90th percentiles.

