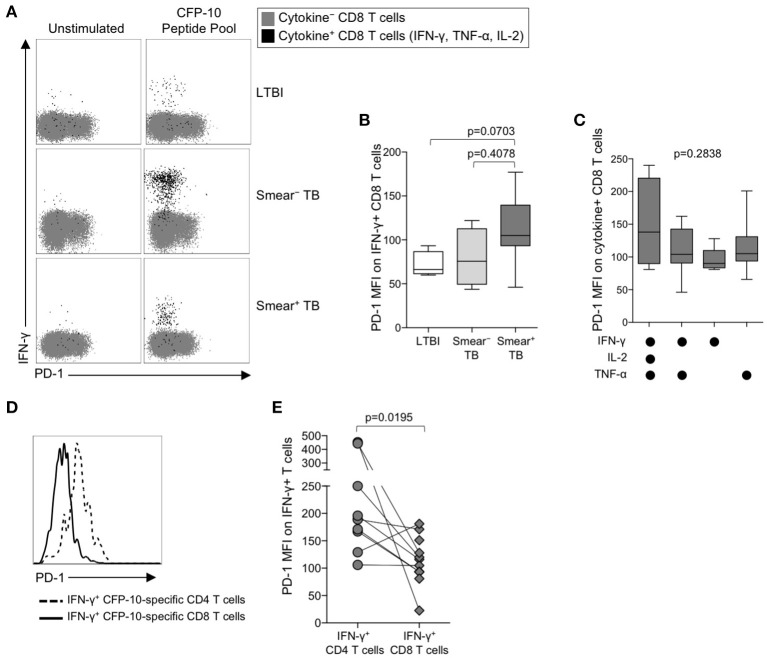
Figure 3.
PD-1 is expressed at lower levels by CFP-10/ESAT-6-specific CD8 T cells, compared with CD4 T cells specific for the same antigens. PD-1 expression on CFP-10 and ESAT-6-specific CD8 T cells was performed as described in Figure 2. (A) Representative flow cytometry data indicating PD-1 expression by CFP-10-specific CD8 T cells producing IFN-γ, TNF-α, and/or IL-2. Flow plots are shown gated on viable CD3+CD8+ lymphocytes; gray cells indicate cytokine− CD8 T cells and black cells indicate cytokine-positive CD8 T cells expressing any combination of IFN-γ, TNF-α, and IL-2. (B) PD-1 expression by CFP-10/ESAT-6-specific IFN-γ+ CD8 T cells (LTBI: n = 4; smear− TB: n = 4; smear+ TB: n = 13). Differences were assessed by a Kruskal-Wallis test; the p-values shown have been adjusted for multiple comparisons using Dunn's post-test. (C) PD-1 expression on subsets of CFP-10/ESAT-6-specific CD8 T cells from smear+ TB patients producing the indicated combinations of IFN-γ, TNF-α, and IL-2. Only cytokine+ subsets present at ≥ 0.01% of CD8 T cells, after subtraction of background cytokine production, were analyzed for PD-1 expression. No significant differences in PD-1 expression were found between any of the different cytokine-producing subsets (Kruskal-Wallis test). (D) Histogram overlay comparison of PD-1 expression on IFN-γ+ CD4 and CD8 T cells following stimulation of whole blood from a smear+ TB patient with a CFP-10 peptide pool. The dotted line represents PD-1 MFI on IFN-γ+ CD4 T cells and the solid line represents PD-1 MFI on IFN-γ+ CD8 T cells measured at the same time in the same individual. (E) Comparison of PD-1 expression on IFN-γ+ CD4 and CD8 T cells specific for the same antigen (either a CFP-10 peptide pool or an ESAT-6 peptide pool) within the same individual (n = 9 smear+ TB patients). Differences in PD-1 expression between Mtb-specific CD4 and CD8 T cell responses within the same individual were determined by the Wilcoxon matched pairs signed rank test. For box plots in (B, C), the horizontal line represents the median, the box the interquartile range, and the whiskers the 10th and 90th percentiles.

