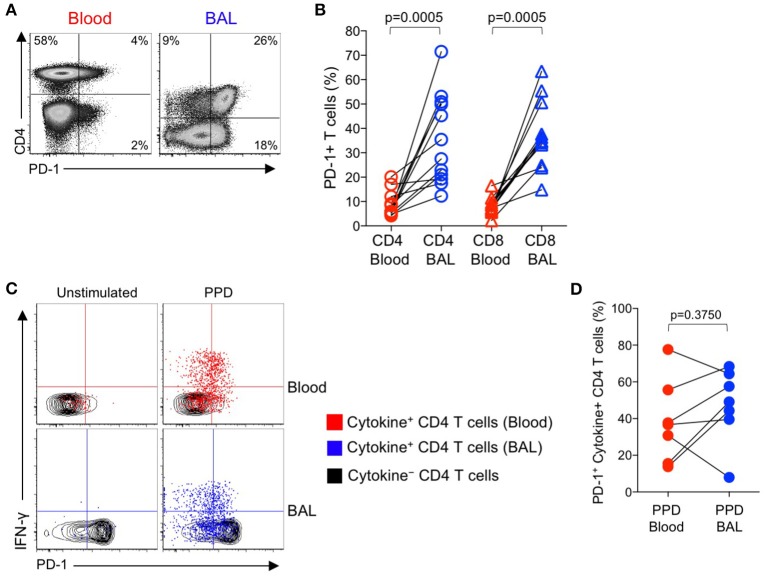
Figure 4.
PD-1 expression by PPD-specific CD4 T cells is similar in the lung and peripheral blood of individuals with LTBI. Bronchoalveolar lavage (BAL) was performed on individuals with LTBI (n = 12); blood samples collected just prior to the BAL procedure. Whole blood and cells isolated from BAL fluid were stimulated in parallel with PPD for 6 h. PD-1 expression was measured on cytokine+ (IFN-γ, TNF-α, and/or IL-2) PPD-specific and total CD4 and CD8 T cells in blood and BAL by flow cytometry. (A) Flow cytometry data of PD-1 expression by T cells from paired blood and BAL samples from a single individual with LTBI. Plots are shown gated on viable CD3+ T lymphocytes. (B) Comparison of PD-1 expression on the total CD4 and CD8 T cell populations in paired blood and BAL samples from individuals with LTBI. (C) Flow cytometry data indicating PD-1 expression by cytokine+, PPD-specific CD4 T cells from paired blood and BAL samples from two individuals with LTBI. Plots are shown gated on viable CD3+CD4+ lymphocytes. Cells in gray indicate cytokine− CD4 T cells (for both blood and BAL samples); cells in red indicate PPD-specific CD4 T cells in the blood producing any combination of IFN-γ, TNF-α, and IL-2; cells in blue indicate PPD-specific CD4 T cells in BAL producing any combination of IFN-γ, TNF-α, and IL-2. (D) Comparison of PD-1 expression by PPD-specific CD4 T cells producing any combination of IFN-γ, TNF-α, and IL-2 in paired blood and BAL samples from individuals with LTBI (n = 7). Differences in (B, D) were assessed using the Wilcoxon matched pairs signed rank test.

