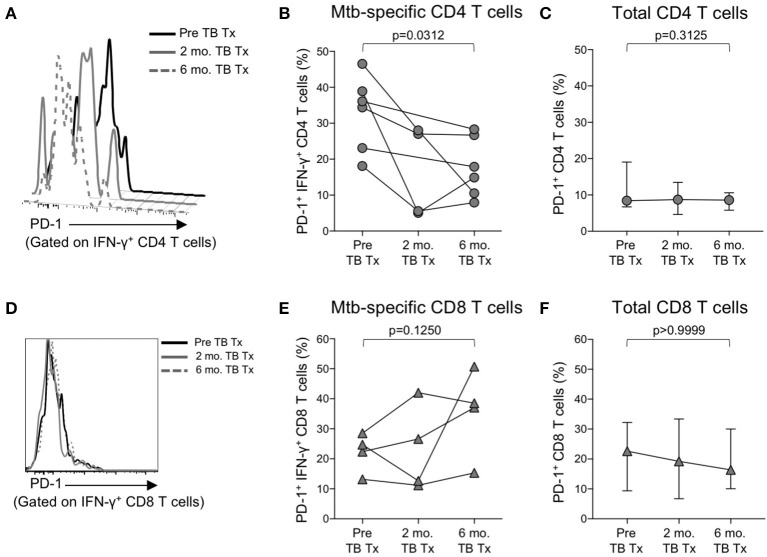
Figure 5.
PD-1 expression on Mtb-specific CD4 T cells is associated with bacterial load. Flow cytometry was used to measure PD-1 expression on CFP-10/ESAT-6-specific IFN-γ+ CD4 and CD8 T cells in smear+ TB patients at 3 time points: prior to initiation of TB treatment (pre-TB Tx), and 2 and 6 months following initiation of treatment. (A) Histogram overlay of PD-1 expression on IFN-γ+ CD4 T cells following 8 h stimulation of whole blood from a smear+ TB patient with a CFP-10 peptide pool at the three time points indicated. PD-1 MFI is shown after gating on viable CD3+CD4+IFN-γ+ lymphocytes. (B) Longitudinal analysis of PD-1 expression on CFP-10/ESAT-6-specific IFN-γ+ CD4 T cells within the same individuals over time (n = 6 smear+ TB patients with IFN-γ+ CD4 T cell responses detectable at more than one time point). (C) Median and interquartile range of PD-1 expression on total CD4 T cells from the same smear+ TB patients shown in (B). (D) Histogram overlay of PD-1 expression by IFN-γ+ CD8 T cells following 8 h stimulation of whole blood from a smear+ TB patient with a CFP-10 peptide pool at the three time points indicated. PD-1 MFI is shown after gating on viable CD3+CD8+IFN-γ+ lymphocytes. (E) Longitudinal analysis of PD-1 expression on CFP-10/ESAT-6-specific IFN-γ+ CD8 T cells within the same individual over time (n = 4 smear+ TB patients with IFN-γ+ CD8 T cell responses detectable at more than one time point). (F) Median and interquartile range of PD-1 expression on total CD8 T cells from the same smear+ TB patients shown in (E). For (B,C,E,F), differences in PD-1 expression prior to (pre-TB Tx) and at the end of TB treatment (6 mo. TB Tx) were determined using the Wilcoxon matched pairs signed rank test.

