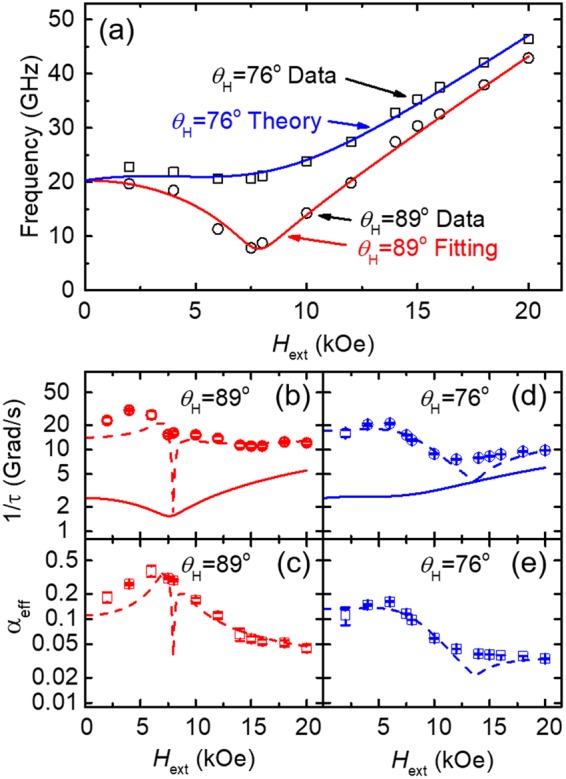
Figure 4.

(a) Measured f vs. Hext results for the 400 οC sample at θH = 89° (open circles) and θH = 76° (open squares) and corresponding modeling at θH = 89° (red line) and θH = 76° (blue line). (b) The measured inverse of relaxation time (1/τ) at θH = 89° (open symbols) and the fitting of 1/τ based on Eq. 5 (dotted line). For reference, the first term of 1/τ in Eq. 5 is also plotted (solid line), which accounts for the contribution from the Gilbert damping only. (c) αeff as a function of Hext for θH = 89° (red circles). The dotted line shows the predicted αeff using the α extracted from the fitting of 1/τ. (d,e) depict similar plots of 1/τ and αeff for θH = 76°.
