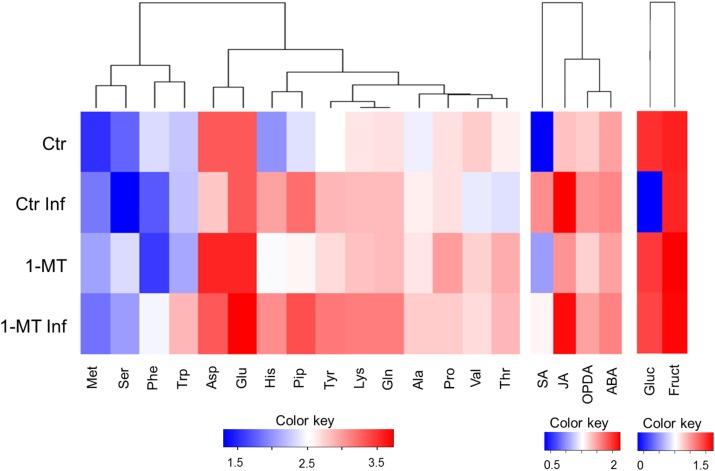
FIGURE 5.
Heatmap visualization of the content of metabolites in the apoplast in water- and 1-MT-treated tomato plants on P. syringae infection. Apoplast extract was collected at 48 hpi and hormone, amino acid and sugar content were analyzed. Ctr, untreated and uninfected plants; Ctr Inf, untreated and inoculated plants; 1-MT, treated plants; 1-MT Inf, treated and inoculated plants. Columns present the different metabolites analyzed; Color key indicates log transformation of metabolite concentration, blue: Lowest, red: highest.

