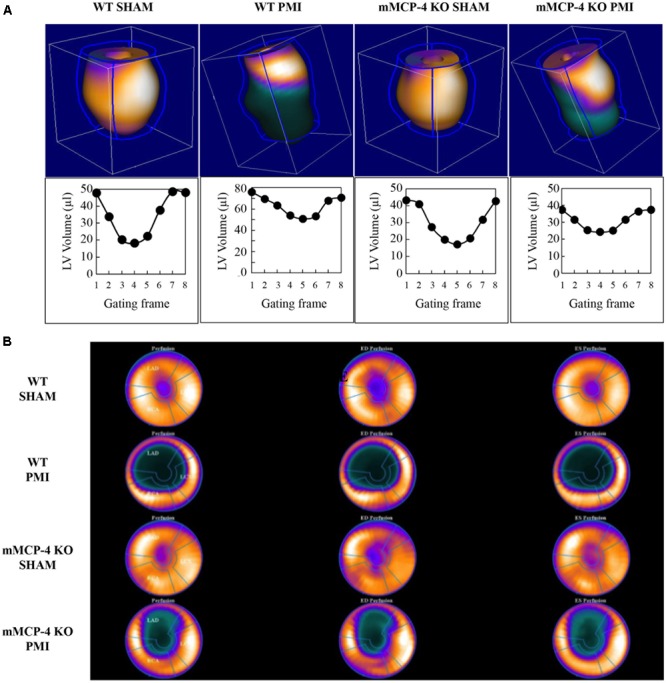
FIGURE 2.

Representative cardiac PET imaging of mouse hearts after PMI (A). Mouse hearts were imaged 3 days following surgery with 18F-FDG, and 3-dimension images were reconstructed. Below each reconstructed image is the ECG-gated left ventricular volume, measured through eight time points of the cardiac cycle (gating frames) for the same mouse. Polar maps of the mouse hearts were calculated, with the apex in the center, for the calculation of the infarcted area (B).
