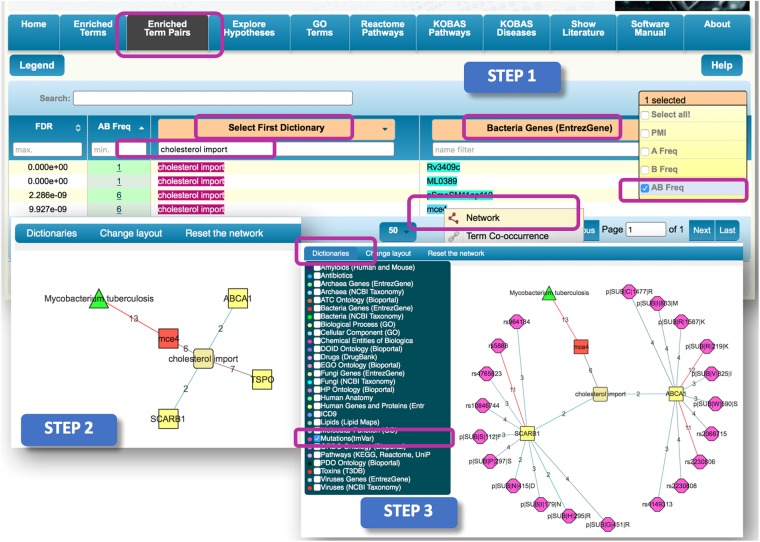
Figure 3.
Step-by-step illustration of how DES-Mutation can be used to identify relationships between low cholesterol and MTB infection. The red square represents the “Bacteria Genes (EntrezGene)” dictionary; the green triangle represents the “Bacteria (NCBI Taxonomy)” dictionary; the yellow square represents the “Human Genes and Proteins (EntrezGene)” dictionary; and the pink octagons represent the “Mutations (tmVar)” dictionary. The edge color is distributed across a color spectrum from red (strong association) to blue (weaker association) based on the frequency of co-occurrence. The number on each edge represents the number of publications that link the associated nodes.

