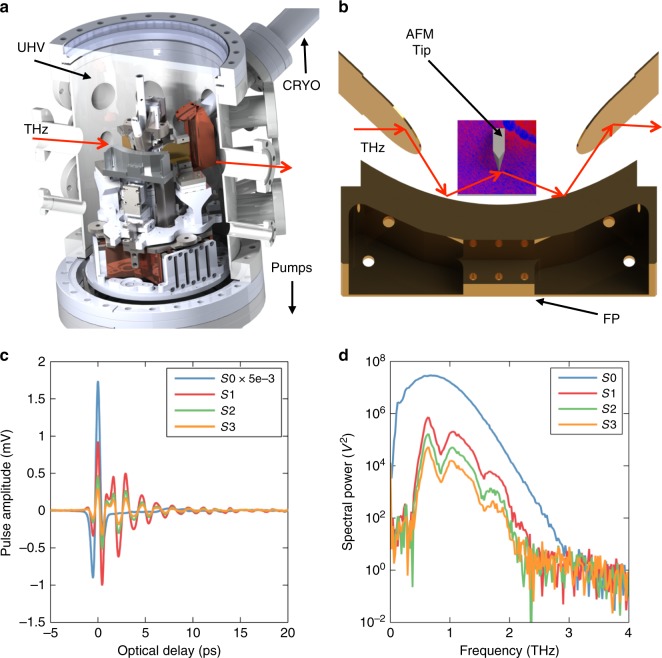
Fig. 1.
Schematic and typical performance of the THz-SNOM. a Schematic of the THz-SNOM. The THz pulse (red arrow) is sent through a UHV vacuum chamber housing the custom SNOM. The sample is coupled to a heater and liquid-He flow cryostat (CRYO), allowing for operation at temperatures from 40 to 400 K. b Detail view of the SNOM inside the chamber. The same focusing parabola (FP) is used to both focus the THz pulse onto the tip (not shown to scale) and collect the tip-scattered light. c Broadband THz pulse (blue, S0) and the near-field THz pulse measured in the system on gold in a dry-air-purged environment. S1, S2, and S3 are the detected THz signal demodulated at the first, second, and third harmonic of the tip tapping frequency. d Measured THz spectrum of the far-field pulse (blue) and the near-field spectrum for different harmonics, collected on gold

