
FIGURE 2.
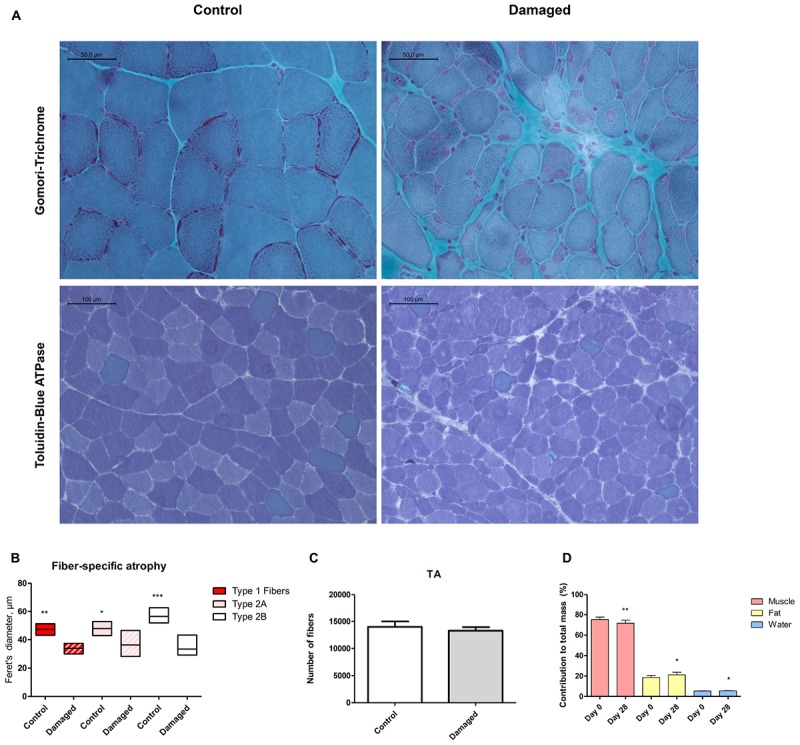
(A) Histochemical analysis via Gomori trichrome staining reveals regenerating fibers, centrally located nuclei and necrosis (upper panel). Toluidine blue staining shows fiber type specificity (lower panel). (B) Quantification of Feret’s diameter reveals pronounced type 2b fiber atrophy (n = 5). (C) No significant difference in number of muscle fibers between damaged and control muscle (n = 3). (D) Decreased lean body mass, increased fat mass and increased body water content 28 days post surgery (n = 8). ∗p < 0.05, ∗∗p < 0.01, ∗∗∗p < 0.001.