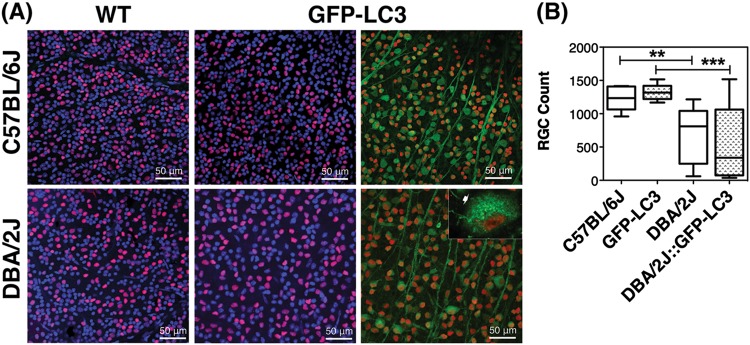
Fig. 7. RGC quantification in C57BL/6J and DBA/2J mice.
a Representative images from whole retinal flat mounts from no-GFP and GFP mice stained with anti-Brn3a (red fluorescence). Green represents endogenous GFP-LC3 fluorescence. Arrow in the inset indicates LC3 puncta. b Quantification of the number of Brn3a-positive cells. Data are the means ± SD; **p < 0.01, ***p < 0.001, Tukey test; nC57BL/6J = 10, nDBA/2J = 14, nGFP-LC3 = 9, nDBA/2J::GFP-LC3 = 12

