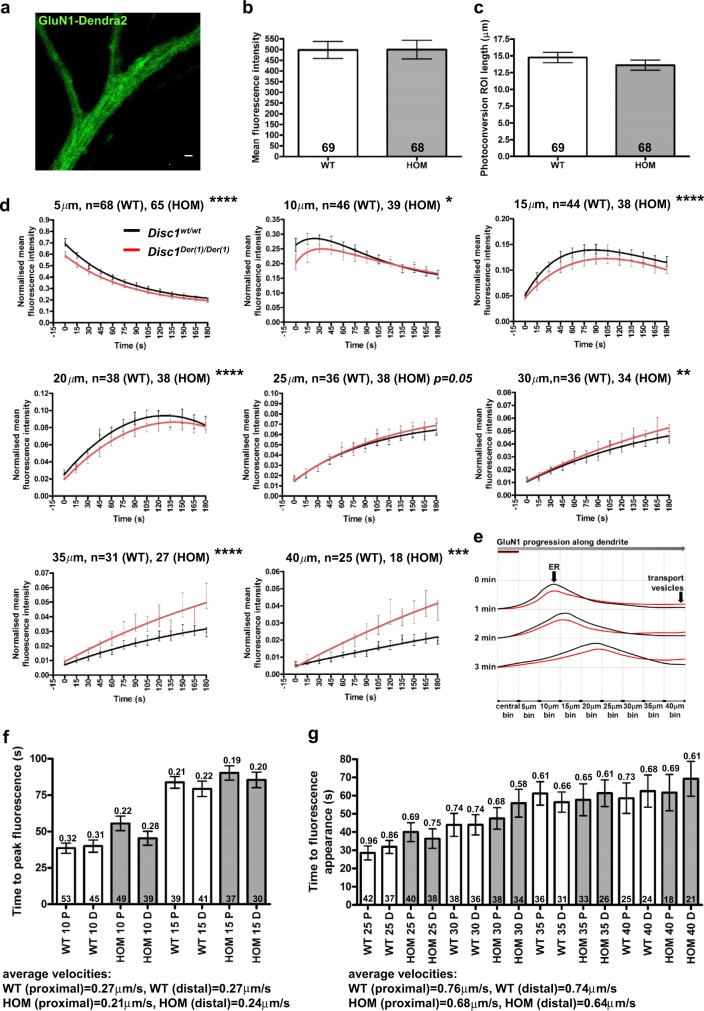
Fig. 4. Altered distal dendritic NMDAR trafficking in Disc1Der1/Der1 hippocampal neurons.
a Green Dendra2 fluorescence in dendrites of a DIV8 mouse hippocampal neuron transfected with GluN1–Dendra2 plus HA–GluN2B. Scale bar, 5 μm. b and c Mean red fluorescence intensity (b), or ROI dendritic length (c), in the central bin in Disc1wt/wt and Disc1Der1/Der1 DIV8 neurons was equal at time zero following photoconversion. d Quantification of fluorescence intensity over time in successive 5 μm dendritic bins distal to the centre of the photoconversion ROI. Data analysed by timepoint-paired two-tailed t test. e Model of dendritic GluN1–Dendra2 motility. Photoconverted GluN1–Dendra2 progresses in a wave-like fashion, with the fastest and slowest moving GluN1–Dendra2 at the leading and trailing edges, respectively, and the bulk travelling as the ‘crest’. f Fluorescence peak velocity estimates for the 10-μm and 15-μm bins. Average time to peak fluorescence was converted to velocity, indicated above each bar. Average velocities were determined from the two bins. g Fast-moving GluN1–Dendra2 maximum velocity estimates for the 25-μm–40-μm bins. Average time to fluorescence appearance was converted to velocity, indicated above each bar. Average velocities were determined from the four bins. WT, Disc1wt/wt; HOM, Disc1Der1/Der1. Error bars represent SEM. ****p < 0.0001; ***p < 0.001; **p < 0.01; *p < 0.05; n indicated on graphs

