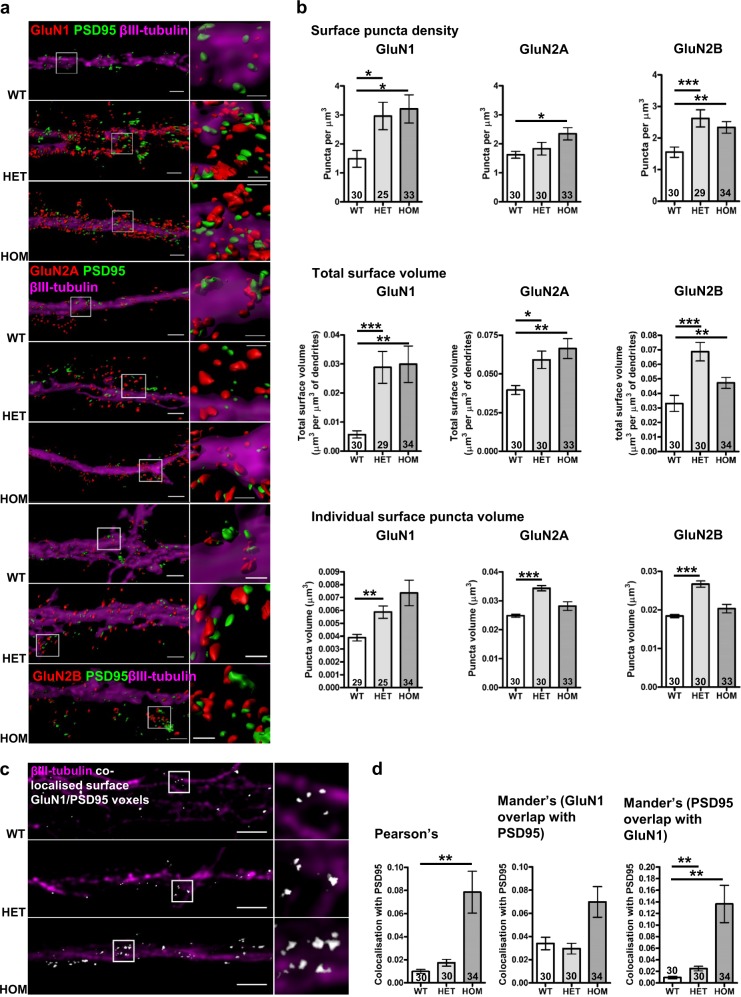
Fig. 5. Altered dendritic NMDAR surface expression and GluN1 localisation to the post-synaptic density in Disc1wt/Der1 and Disc1Der1/Der1 hippocampal neurons.
a Objects in 3D-SIM images were visualised using the Imaris Isosurface tool. Touching objects are separated with boundary lines between touching objects visible in the enlarged images. Scale bars, 2 μm in the full-size images, 0.6 μm in enlarged insets indicated by white boxes (b) GluN1, GluN2A or GluN2B surface puncta density, total surface volume and individual surface puncta volume (all normalised to dendritic segment volume) from 3D reconstructions of primary dendrite segments of cultured DIV21 hippocampal neurons. Data analysed by Kruskal–Wallis (puncta density p = 0.02, p = 0.03, p = 0.0004, total volume p = 0.0025, p = 0.4, p = 0.003, puncta volume p = 0.003, p < 0.0001, p < 0.0001 for GluN1, GluN2A and GluN2B respectively) followed by Dunn’s multiple comparison test. c Reconstructed 3D-SIM images of dendrites. Co-localised voxels, which contain signals from both PSD95 and surface-expressed GluN1 are shown in white. Scale bars, 3 μm. d GluN1 co-localisation with the PSD95 was evaluated on three measures. Pearson’s and Mander’s coefficients, respectively, indicate the overall correlation of each signal or amount of GluN1 signal co-localised with PSD95 signal, and vice versa. Data were analysed by Kruskal–Wallis (p = 0.004, p = 0.08, p = 0.001 for Pearson’s, Mander’s M1 and Mander’s M2), followed by Dunn’s multiple comparison test. WT, Disc1wt/wt; HET, Disc1wt/Der1; HOM and Disc1Der1/Der1. Error bars represent SEM. ***p < 0.001; **p < 0.01 and *p < 0.05; n indicated on graphs

