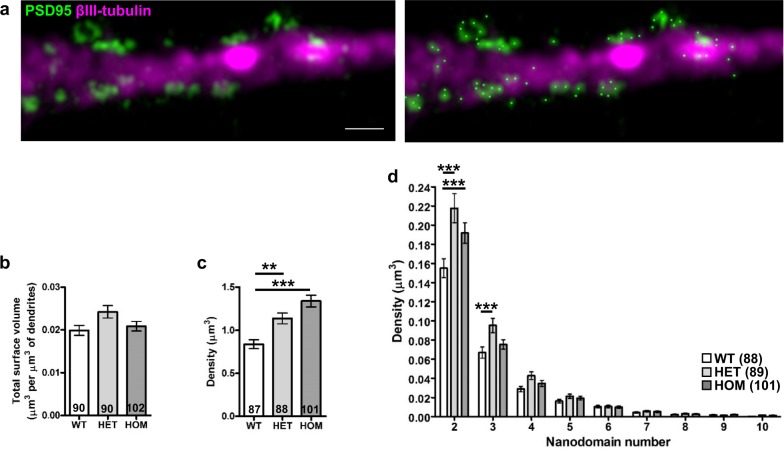
Fig. 6. Altered PSD95 distribution in Disc1wt/Der1 and Disc1Der1/Der1 hippocampal neurons.
a Left, raw 3D-SIM image of a dendrite with PSD95 clusters and nanodomains. Right, the same image with nanodomain centres (bright green spots) identified using Imaris. Scale bar, 1 μm. b PSD95 total volume normalised to dendritic segment volume. Data analysed by Kruskal–Wallis (not significant). c Quantification of single PSD95 nanodomains. Data analysed by one-way ANOVA (p < 0.0001). d Quantification of PSD95 nanodomain number per cluster. Data analysed by two-way ANOVA which found a significant interaction between genotype and nanodomain number per cluster (p < 0.0001). WT, Disc1wt/wt; HET, Disc1wt/Der1; HOM and Disc1Der1/Der1. Error bars represent SEM. ***p < 0.001 and **p < 0.01; n indicated on graphs

