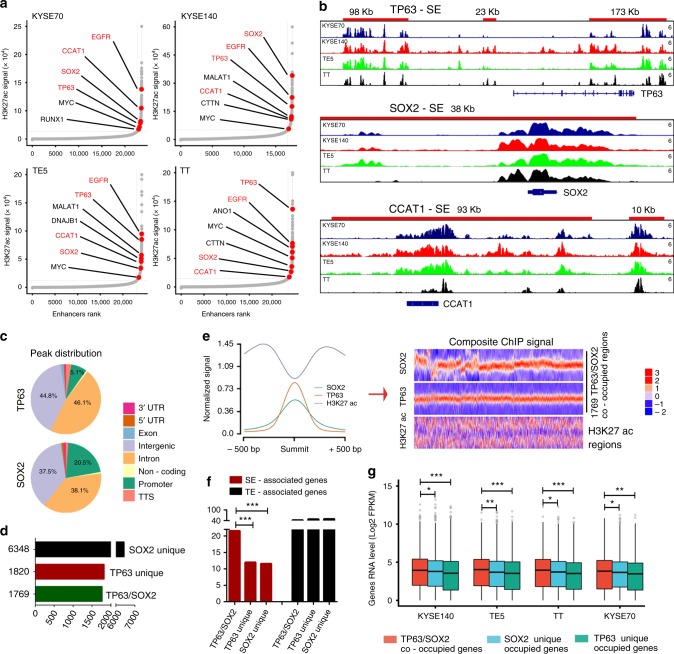
Fig. 1.
Super-enhancers are associated with TP63 and SOX2 in SCCs. a Hockey stick plots on the basis of their input-normalized H3K27ac signals in KYSE70, KYSE140, TE5, and TT cell lines. Know super-enhancer-associated oncogenes are highlighted. b Gene tracks of H3K27ac ChIP-seq occupancy at representative super-enhancer-associated gene loci in four cell lines. X axis shows genomic position and Y axis shows signal of ChIP-seq occupancy in units of reads per million mapped reads per base pair (rpm/bp). c Genome-wide distribution of TP63 and SOX2 ChIP-seq peaks in TE5 cells. d The number of TP63 unique, SOX2 unique and TP63/SOX2 co-occupied genomic loci in TE5 cells. e Left: line plots showing ChIP-seq signals of TP63, SOX2 and H3K27ac centered at the summit of TP63 and SOX2 peaks in TE5 cells. Right: heatmap of ChIP-seq signals for TP63, SOX2, and H3K27ac (±500 bp windows around the center of summit) rank ordered by TP63 signal. Red reflects enrichment. f Proportion of super-enhancer (SE)-associated genes (red) and typical-enhancer (TE)-associated genes (black) either uniquely bound or co-bound by TP63 and SOX2. g mRNA level of super-enhancer-associated genes either uniquely bound or co-bound by TP63 and SOX2. Red, blue, and green box plot represents the expression levels of TP63/SOX2 co-occupied genes, TP63 uniquely occupied genes and SOX2 uniquely occupied genes, respectively

