Fig. 2.
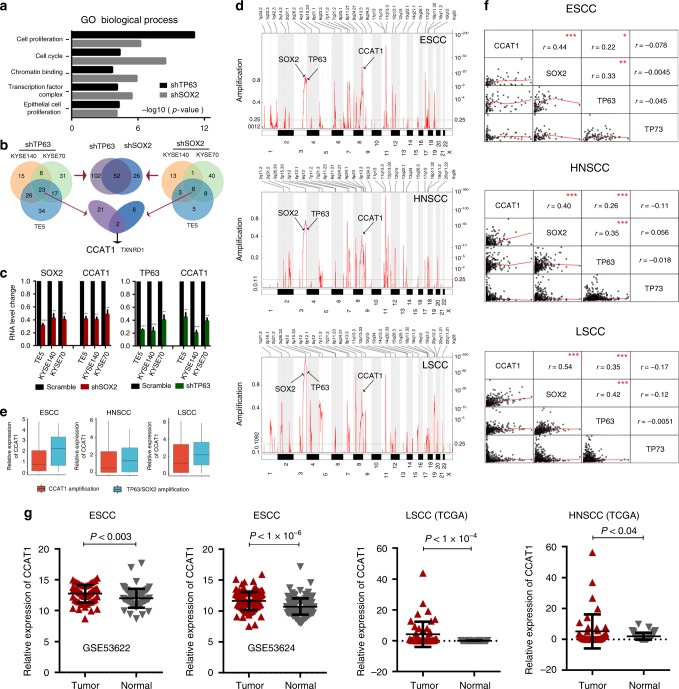
CCAT1 is overexpressed and regulated by TP63 and SOX2 in SCCs. a GO functional categories of downregulated genes upon TP63 or SOX2 silencing. b Integrative analysis of TP63 and SOX2 co-regulated downstream super-enhancer targets, which are co-occupied by TP63 and SOX2 in three SCC cell lines. c CCAT1 mRNA expression upon silencing of either TP63 or SOX2. Data are presented as mean ± SD of three replicates. ** P < 0.01, *** P < 0.001. P values were determined using t-test. d Plots showing high-level amplifications of TP63, SOX2, and CCAT1 loci in esophageal squamous cell carcinomas (ESCC), head and neck squamous cell carcinomas (HNSCC) and lung squamous cell carcinomas (LSCC). X axis shows chromosomal regions, Y axis shows the G score (left) and false discovery rate q-values (right). e Relative expression of CCAT1 in CCAT1 independently amplified and TP63/SOX2 co-amplified tissues. Red or blue box plot represent CCAT1 or TP63/SOX2 co-amplification samples, respectively. f Correlation plots comparing CCAT1, SOX2, and TP63 expression in ESCC, HNSCC, and LSCC. TP73 was included as a negative control. r represents correlation value; *represents P values. * P < 0.05, ** P < 0.01, *** P < 0.001. P values were determined using t-test. Data of d–f from the Cancer Genome Atlas Network (TCGA). g CCAT1 expression in tumor and nonmalignant samples across three types of SCCs. Data from GSE53622, GSE53624, and TCGA. Significance was marked with P values

