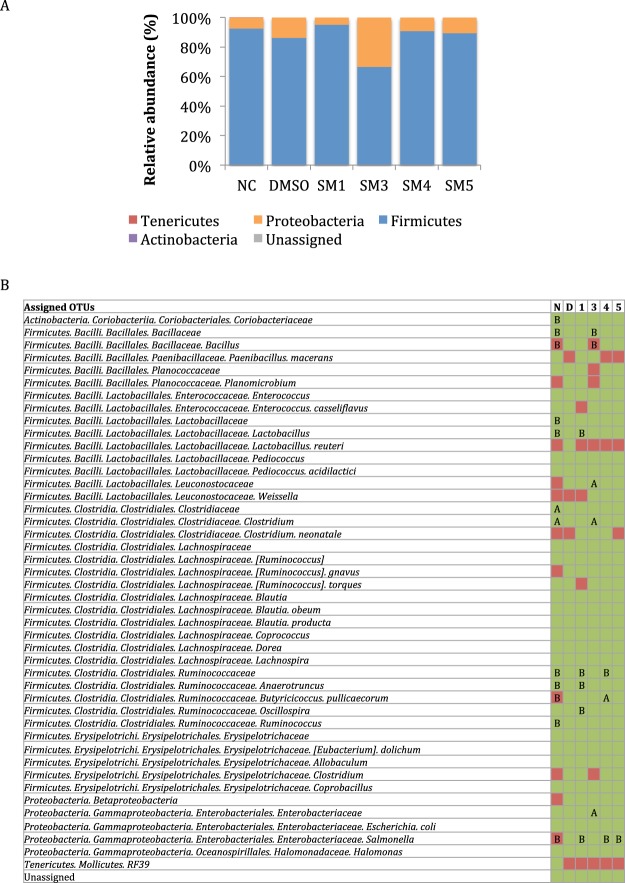
Figure 7.
Impact of the small molecule (SM) treatments on microbiota diversity and relative abundance in chicken ceca. (A) Relative abundance at the phylum level. (B) Taxonomic diversity and significant differences between treatments in the cecal microbiota. In green: operational taxonomic units (OTUs) detected in the chicken ceca; in red: OTUs not detected in chicken ceca; A and B indicate whether the OTUs were significantly lower or higher, in abundance, respectively, compared to the 1% dimethyl sulfoxide (DMSO) group (P < 0.01); N and NC: not infected, not treated; D: DMSO-treated; 1, 3, 4, 5: treated with SM1, SM3, SM4, or SM5, respectively.

