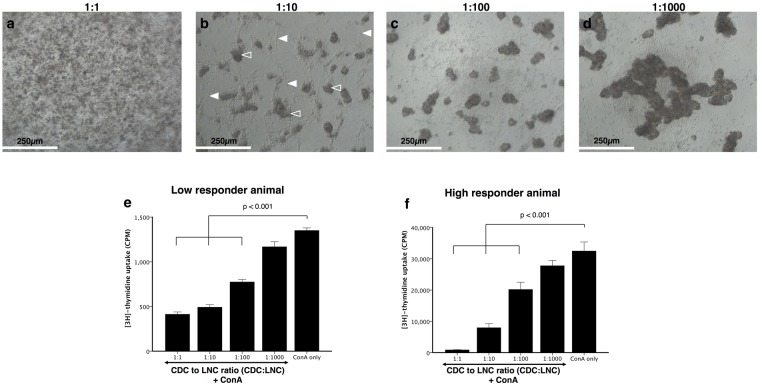
Figure 3.
Dose-response relationship in cardiosphere-derived cell (CDC) suppression of lymph node cell (LNC) activation. All cultures contained ConA, with ratios of 1:1 to 1:1000 of CDC:LNCs. Panels a–d are representative photomicrographs of dose-response experiments, showing little proliferation at a 1:1 ratio (a) and increasing lymphocyte blast formation with fewer CDCs (b–d). Filled arrows indicate the CDCs and open arrows the LNC blast formation. There was inhibition of LNC activation at 1:1, 1:10 and 1:100 ratios (n = 3, p < 0.001, e and f), with inhibition lost at 1:1000 (n = 3, p = 0.298). The response is similar in a low responder animal (e) and a high responder animal (f), the third biological repeat is not displayed. Bars represent mean ± SEM of triplicate sample, n = 3 dogs; Scale bars = 250 µm.

